LOCUS Opportunity Zone Navigator
Using the Opportunity Zone Navigator
To view the boundaries of the Opportunity Zone census tracts
- Turn on the “Opportunity Zones and Transit,” “Zones with Brownfields,” “Population Density,” “Affordability,” or “Commercial/ Industrial Jobs” layers, located in the upper lefthand corner of the map.
To locate a specific location by name or address
Click on the grey magnifying glass located![]() in the lower lefthand corner of the map display.………
in the lower lefthand corner of the map display.………
To view layer-specific information
- Turn on each data layer to display the following information by selecting a census tract. Click here for a comprehensive data dictionary.
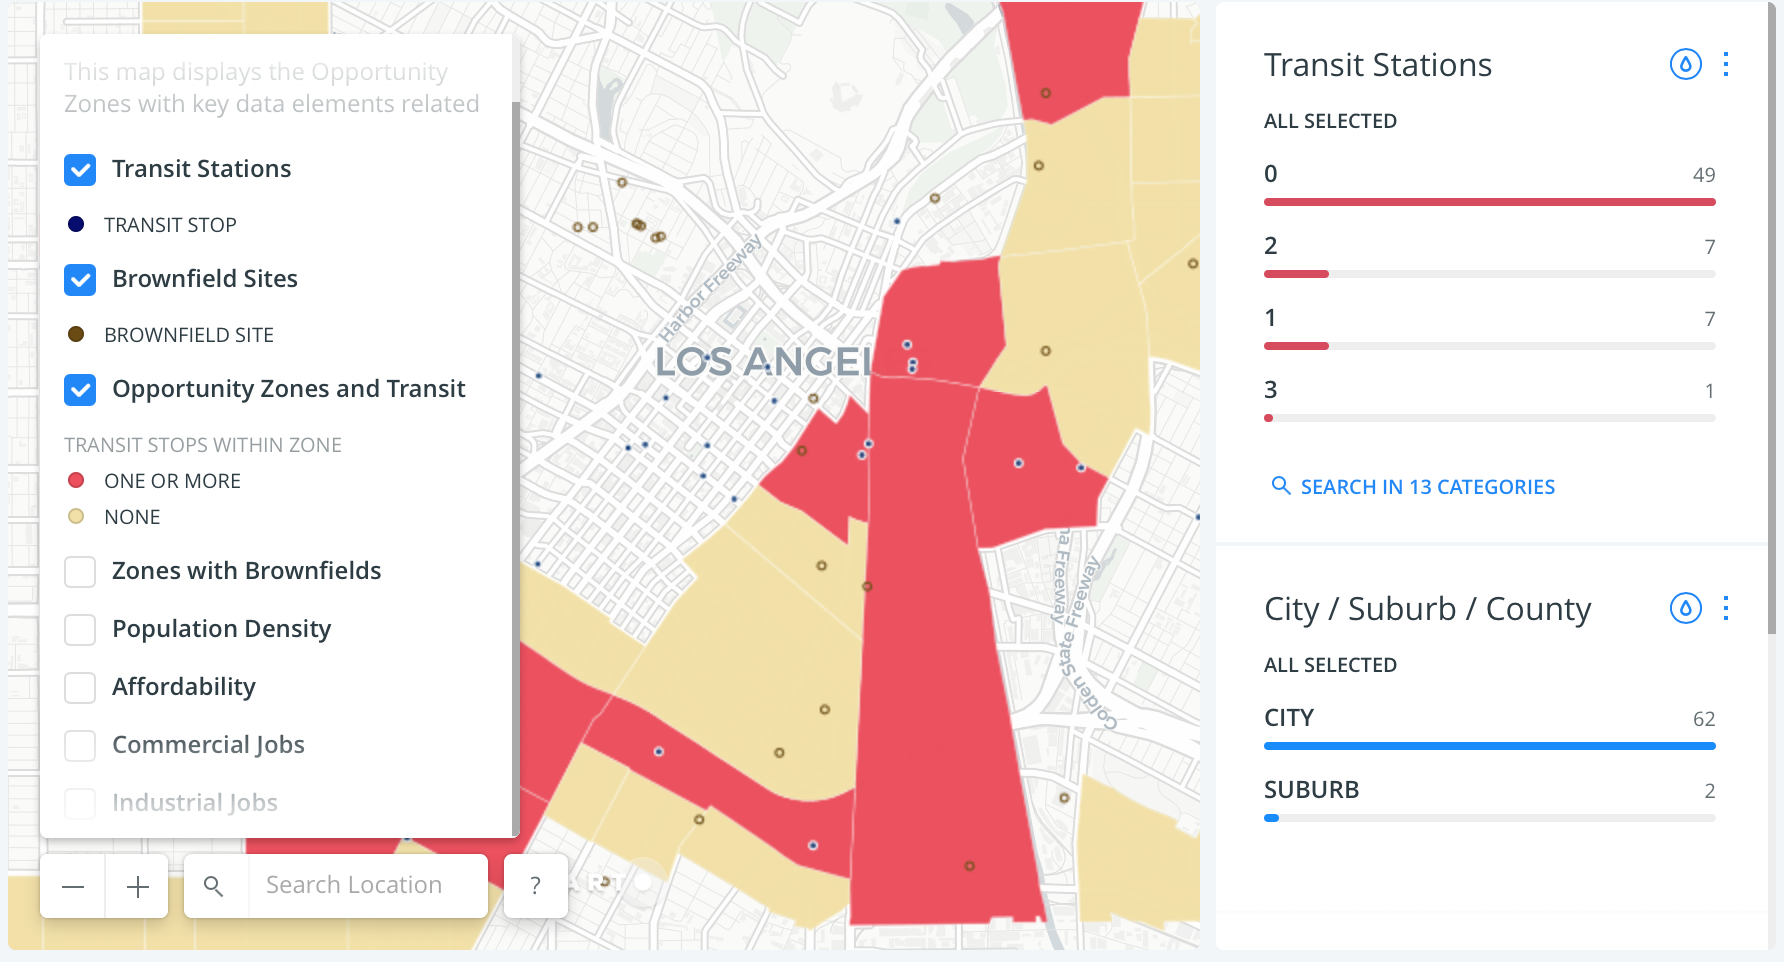
Transit Stations
- Location of transit station
- Agency name
- Station name
To view this information, click on the black dot marking a transit station on the map.
Brownfield Sites
- Location of site
- Site name
To view this information, click on the yellow dot marking a Brownfield site on the map.
Opportunity Zones and Transit*
- Census tracts with no transit stations
- Census tracts with one or more transit stations
- Census tract number
- City/ Suburb/ Rural
- MSA/ County
- Total number of transit stations
- Population
- Total number of jobs
Zones with Brownfields*
- Census tract number
- City/ Suburb/ Rural
- MSA/ County
- Number of Brownfields
Population Density*
- Census tract number
- Population
- Density, persons per acre
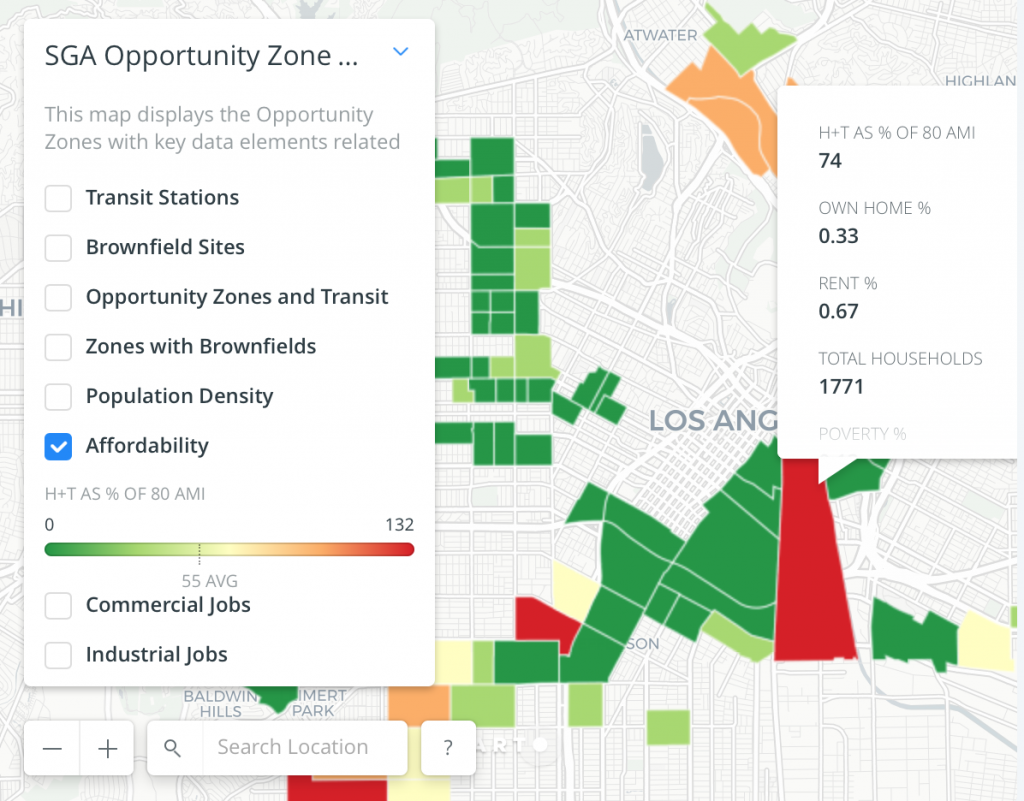
Affordability*
- H + T as % of 80 AMI
- % of residents owning homes
- % of residents renting
- Total number of households
- Poverty rate
- Census tract number
- MSA/ County
Commercial Jobs*
- Census tract number
- All jobs in tract
- All commercial jobs in tract
- % commercial jobs in tract
Industrial Jobs*
- Census tract number
- All jobs in tract
- All industrial jobs in tract
- % industrial jobs in tract
* data per census tract
To view layer-specific information
- Select only that layer whose data you wish to view and click on the census tract you would like to learn more about. The “Transit Station” and Brownfields” layers can be turned on at all times. If all other layers are selected, you will only be able to view the data displayed by the “Opportunity Zones and Transit” layer.
To view data beyond the census tract level
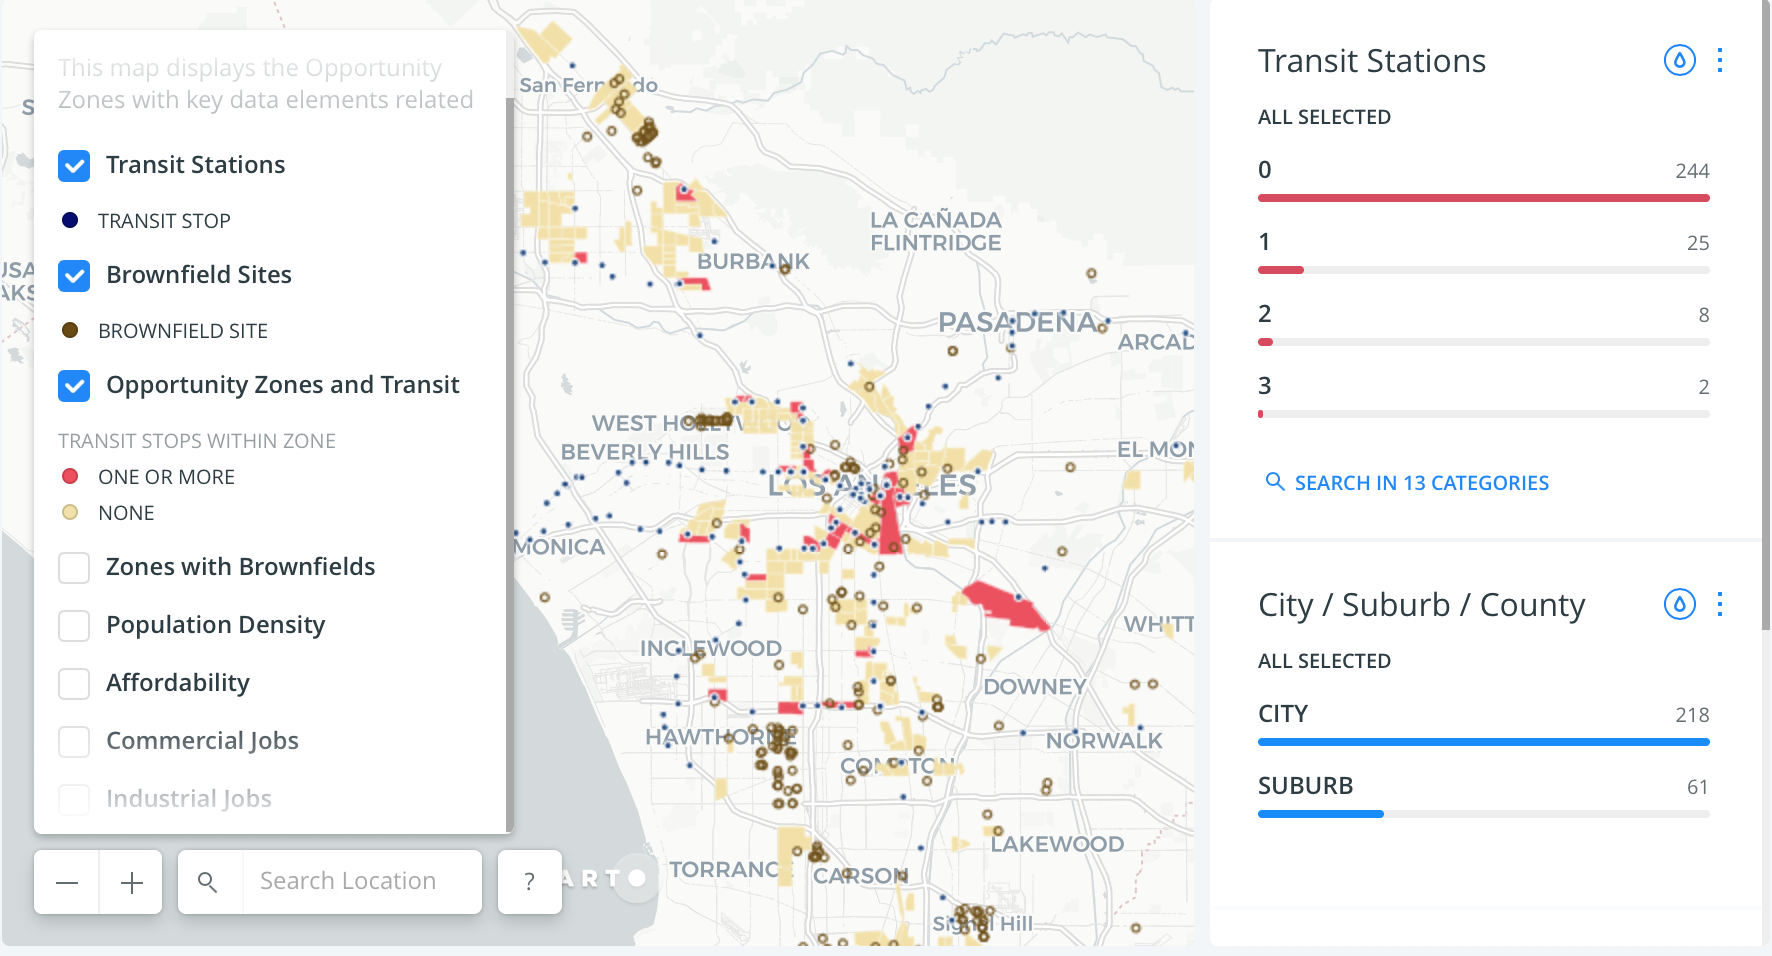
- The widget panel occupying the far right column of the map depicts aggregate information about the census tracts captured by the zoom of the map. For example, the closer you zoom in on the map, the less census tracts you capture. The widget panel will display aggregate information about that small number of captured census tracts. If you are zoomed in on an area that does not contain Opportunity Zones, the widget panels will display “No Data Available” messages.
- The further you zoom out on the map, the more census tracts you capture. The widget panel will display aggregate information about that larger number of captured census tracts.
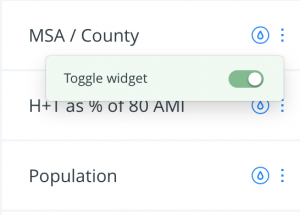
Expanding widgets
- In order to view the “MSA/County,” “H + T as % of 80 AMI,” “Population,” and “Jobs” widgets for an area zoom, click the three vertical dots next to each widget title. This function will collapse any of the 6 widgets.
![]()