News
By Natasha Riveron, May 8, 2019
 grading framework set a higher bar for communities by emphasizing equity and implementation. Download the full report—The Best Complete Streets Policies of 2018—for the full ranking and community profiles.
In 2005, just 35 communities had adopted Complete Streets policies. At the close of 2018 that number stood at 1,477 Complete Streets policies—in rural areas, small towns, mid-sized suburbs, and big cities that have all realized the benefits of Complete Streets.
The Best Complete Streets Policies of 2018 celebrates the work of these communities to make their streets safer, healthier, and more equitable. This year's report evaluates the 66 Complete Streets policies that were passed in 2018 with Cleveland Heights, OH earning the highest grade.
To learn more about the new, stronger Complete Streets framework or our grading methodology, or to hear first-person stories from several of the communities featured in the report, tune in to our webinar on Thursday, May 16 at 1:00 pm ET.
The top 10 Complete Streets policies from 2018:
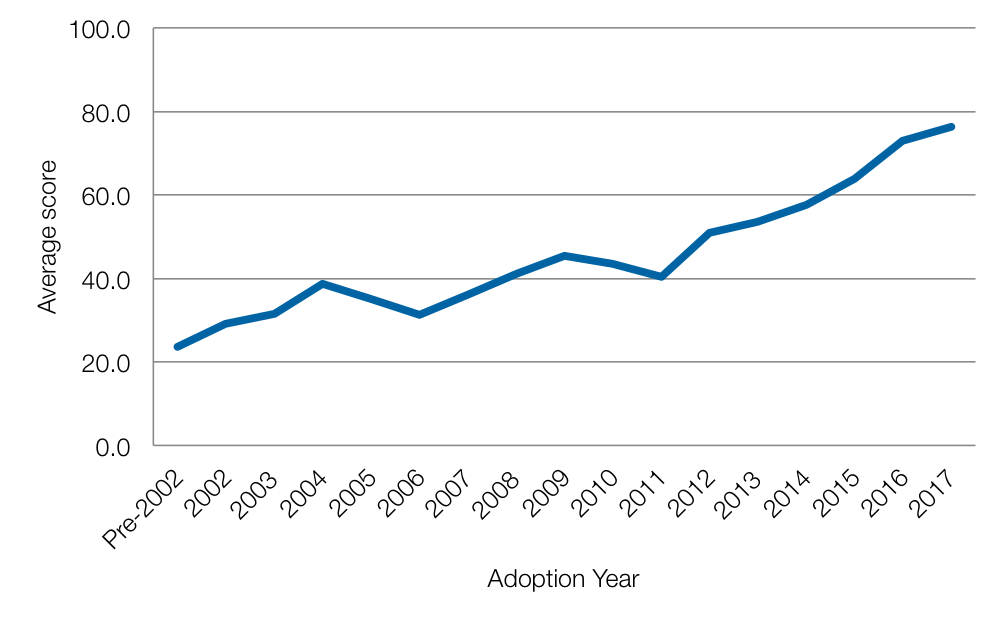
Since 2006, when the National Complete Streets Coalition first evaluated policies, the average score has steadily risen as communities passed stronger policies each year. These gains were a testament to communities passing impactful policies—and learning from one another as the years passed.

Yet pedestrian fatalities have also continued to increase during that same period, reaching levels not seen in nearly three decades, and people in low-income areas and communities of color continue to be killed disproportionately (see Dangerous by Design). So we raised the bar for policy language last year with a new grading framework that emphasizes equity and implementation to better reflect the realities of translating policy into practice.
I.e., will this policy actually make a tangible impact on how streets are designed and built, and will the benefits be distributed equally?
With this new standard, the average score for this year’s policies dropped to 39. But a higher standard will also push communities to go further—to create more impactful policies from the beginning, and update older policies in light of this new framework. The strong scores in the top 10 are a testament to how communities rose to meet the challenge.
Download the full report for a complete ranking of all the new policies passed this year, profiles of five of the top scoring policies, and strong sample policy language for each of the 10 Elements of a Complete Street Policy that you can use in your community to write a strong policy of your own in 2019 or beyond.
Want to learn more about our new framework and how we graded policies this year? Join us for a launch webinar on Thursday, May 16 at 1 p.m. ET.
Congratulations to the top 10 communities and all of the jurisdictions that passed Complete Streets policies in 2018. We look forward to working with you to put these policies into action, and with new communities to pass more Complete Streets policies in years to come.
Related News

© 2026 Smart Growth America. All rights reserved
Site By3Lane Marketing


