


Signature reports
Dangerous by Design: An urgent call to prioritize pedestrian safety
Uncover the urgent truths behind America’s rising pedestrian fatalities and explore transformative solutions to create safer, more inclusive streets for everyone. Join us in reimagining our roadways—prioritizing people over cars to protect lives.
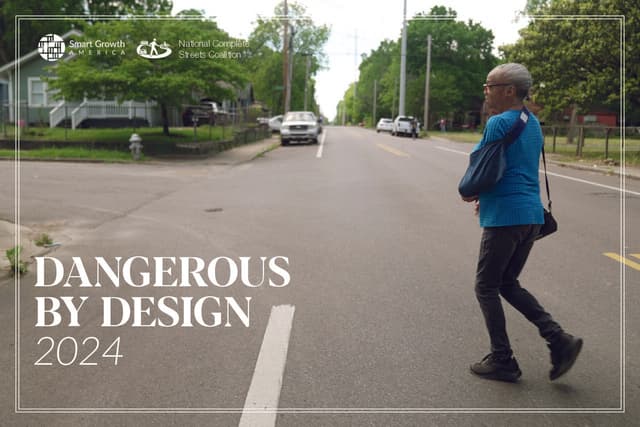
Dangerous by Design 2024: Key findings
Dangerous by Design 2024 finds that 7,522 people were struck and killed while walking in 2022, an average of more than 20 per day. As in previous years, we found that not everyone lives and walks with the same risk. Black and Native Americans, older adults, and people walking in low-income communities die at higher rates and face higher levels of risk compared to all Americans. Our nation’s streets are dangerous by design, designed primarily to move cars quickly at the expense of keeping everyone safe. Unfortunately, this crisis will continue to get worse until those in power finally make safety for everyone who uses our roads a top priority.
Spotlight on Memphis
Memphis takes the top spot. The new #1 most deadly metro area (Memphis, TN) has risen steadily since the first time we ranked metro areas in 2009, with a rate that has nearly tripled from 1.83 up to 5.14 deaths per 100,000 people. 343 people died from 2018-2022, an increase of 158 deaths compared to the previous five-year period (2013-2017). This means that 65 percent of the pedestrian deaths in Memphis over the last decade happened in just the last five years.

A pedestrian safety crisis
A historic increase in these deaths from 2020 to 2021 shocked many, but this epidemic continues to get worse. In 2022, the most recent year with complete federal data, the number of people who were struck and killed while walking grew to 7,522, marking a 40-year high.
This represents an astonishing 75 percent increase in these deaths since 2010. Danger outside of a vehicle is getting consistently worse: The share of all traffic deaths that were people outside of vehicles hit the highest share in 40 years. Those 7,522 deaths are roughly the equivalent of the population of a small town like Buena Vista, Colorado, the student population of Gonzaga University, or more than three Boeing 737s full of people falling from the sky every month for a year. 61,459 people walking were struck and killed in the last decade from 2013-2022, compared to 45,935 in the previous decade from 2003–2012. 61,459 people killed over the last decade is a shocking number. Each one of these deaths was a person who left behind a grieving family and friends.
That trauma is just one of the hidden costs of this crisis that deserves far more attention. There’s the heavy cost and trauma of the hundreds of thousands of (under-reported) injuries during that time. And there’s the countless number of walking trips never taken as millions choose not to risk their lives or livelihoods on dangerous streets where thousands of their neighbors have lost their lives or suffered injuries.

Walking, disabilities, and inclusive language
Making our streets safer for everyone absolutely means for people of all ages and abilities, whether walking, biking, or using assistive devices like wheelchairs or walkers. Due to the available federal data, this report specifically examines only the deaths of people walking and tends to use the shorthand of “pedestrians” for this reason. In addition, USDOT data groups people using assisted mobility devices in the same category as things like skateboards, making it challenging to isolate the impact on people with disabilities. People with disabilities aren’t counted in any specific way that makes it possible to analyze the impact on them. Across the board, better data are required to assess the impact of current infrastructure.
The people most at risk
Income
Rates of death increase as the income of an area decreases. The per-capita pedestrian fatality rate systematically gets more deadly as a census tract’s median incomes go down. Despite only accounting for 17 percent of the population, 30 percent of all pedestrian deaths happen in census tracts with yearly incomes below $50,000. The fatality rate in census tracts with incomes between $15,000 and $25,000 is more than four times higher than in areas with a median income over $100,000 (4.90 vs 1.07).

Race
The data show that people of color, particularly American Indian and Alaska Native populations, are more likely to die while walking than people from any other race or ethnic group. This group, plus Black Americans, combined to account for nearly 22 percent of all pedestrian deaths in metro areas despite accounting for just under 13 percent of the population. Black people are killed at more than twice the rate of white people; Native people are killed at over four times the rate of white people.

These disparities are also felt with injuries
Age
People between the ages of 50 and 65, and people over 75, are more likely to be struck and killed while walking. Crashes that may result in only injuries for younger people are more likely to become severe injuries or deaths for older people. When the mobility of older people is reduced—whether that’s because of the lack of safe infrastructure for walking, the higher risk to their lives, or they stop driving—their social isolation and disconnection increases, which leads to negative health outcomes.

The out-sized impacts (despite underreporting) on Native Americans
Across the US during this same time frame, the pedestrian death rate was 2.06 percent; the death rate on reservations was 3.39 percent. These numbers are striking since nearly 5 percent of Indigenous people living on tribal lands weren’t counted in the 2020 Census. Reservations are oftentimes underinvested in by federal programs and must find ways to improve safety on roads often owned by counties, states, or the interstate highway system. Even for those communities committed to making changes, they face an uphill climb in seeing them funded or installed.
The Centers for Disease Control and Prevention provided support for data analysis and synthesis used in the report under cooperative agreement OT18-1802 supporting the Active People, Healthy NationSM Initiative, a national initiative led by the CDC to help 27 million Americans become more physically active by 2027.
Learn more: https://www.cdc.gov/physicalactivity/activepeoplehealthynation/index.html. The findings and conclusions in this report are those of the authors and do not necessarily represent the official position of the Centers for Disease Control and Prevention.

Livable places. Healthy people. Shared prosperity.


© 2026 Smart Growth America. All rights reserved
Site By3Lane Marketing
