


News
By Smart Growth America, February 14, 2019
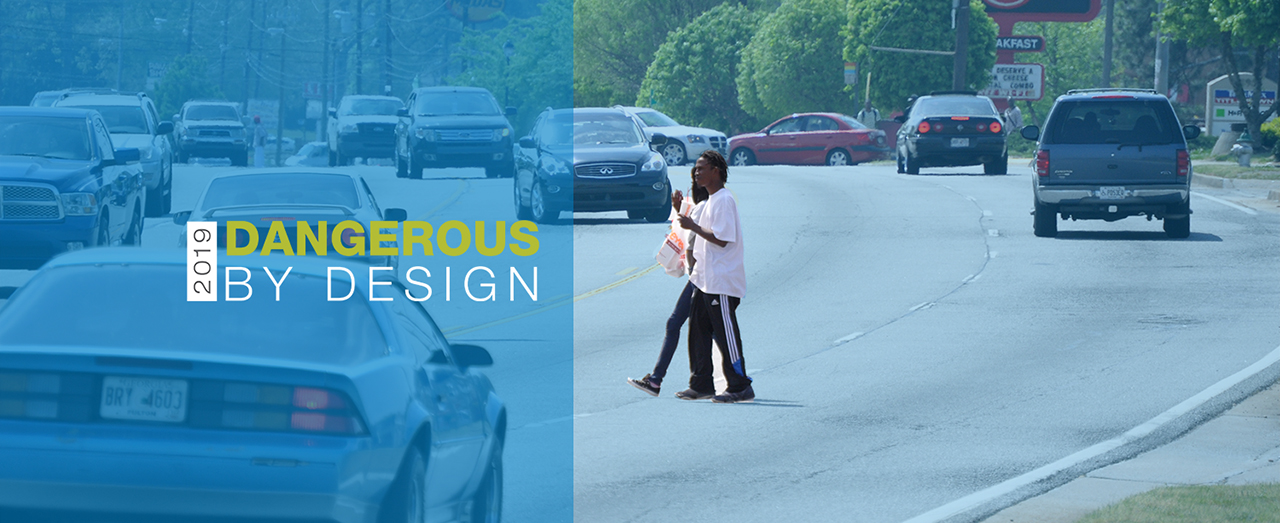
Earlier this month the National Complete Streets Coalition released Dangerous by Design 2019, a report that calls attention to the growing epidemic of pedestrian fatalities and solutions. The report ranks states and metro areas based on how dangerous they are for people walking and shows disparities among people struck and killed while walking based on their age, ethnicity, and the income of the surrounding area.
We walked through the report findings on a recent webinar and answered some top questions during the broadcast. But given the immense interest in the report and webinar, we weren't able to get to all of them live. Below you can watch the entire webinar recording and scroll through questions and answers.
Questions & Answers
- What can local governments do to push Complete Streets policies?
- How do we influence the state DOT to actually act on a Complete Street policy the state has adopted?
- How do we push for change at the national—e.g. pedestrian safety standards for vehicles, changes to MUTCD provisions on signal timing?
The strongest Complete Streets policies lay the groundwork for implementation by including binding, actionable next steps to embed a Complete Streets approach in routine transportation practices and decision making processes. Such steps makes sure the policy changes the culture and day-to-day work of transportation decision-makers—ultimately translating to changes on the ground—instead of just collecting dust on a shelf.
States like Massachusetts have had success incentivizing local Complete Streets policy adoption by creating designated funding programs, and more than 1,300 local, state, and regional governments around the country have adopted Complete Streets policies. However, to continue moving this work forward and creating safer streets for all people, we need more leadership at the state and federal level. We call on all of you to add your voices to the growing call on Congress to adopt a binding federal Complete Streets policy by signing our petition.
What are methods to entice or incentivize municipal engineers to buy into road diets, Complete Streets, reduced travel lanes, and bike & pedestrian paths?
Besides being safer for all users, these types of designs also have important benefits for health, the environment, and the local economy. Holding trainings and workshops to familiarize engineers (and planners, elected officials, and other decision-makers) with the benefits of these approaches as well as evidence-proven strategies like the Federal Highway Administration’s list of 20 tested and proven interventions that can improve safety, is an important step toward changing the kinds of projects transportation professionals and decision-makers deliver.
One other recommendation is to find ways (perhaps at the political or agency level) to redefine the problems that your engineers are trying to solve. Traffic engineers never embarked on a mission to design unsafe streets for pedestrians; that's the end result of tasking engineers, for decades, with the wrong problems to solve. We asked engineers long ago to simply move as many cars as fast as possible with as little delay as possible, and they’ve worked hard to effectively do that. As a result, we end up with arterials that prioritize moving vehicles (not necessarily people) at the expense of everything else. So think of ways that you can use your citizenry or your elected leaders (their bosses!) to redefine the problem for your municipal engineers to solve. Something like: How can our city move more people more efficiently while also building a framework for creating long-term value which helps us build places worth being in, not just passing through?
Who are some of the most important stakeholders to get behind projects and initiatives like the ones discussed?
Besides transportation professionals, elected officials, and other decision-makers that have the power to make these projects a reality, it’s also important to use these projects as opportunities to engage the broader community. This could include residents, bicycle and pedestrian advocacy groups, local business owners, recreation centers, churches, schools, and local artists, as well as emergency service providers, among many others. Taking the time to engage these groups can mean the difference between a safety project that is embraced and celebrated by the community and that begins to change the conversation about the importance of prioritizing safer street design on the one hand, or a project that receives widespread resistance and exposes people’s preferences for faster commutes over safety on the other. For examples of safety demonstration projects that worked to engage the community, with varying degrees of success, check out these case studies in Orlando, Lexington, and South Bend from last year’s Safe Streets Academy.
- How much research was done regarding toxicology in pedestrians, how many were at night, were the pedestrians wearing dark clothes, cell phones, listening to music, etc. In other words, how many of these deaths were pedestrian incited?
- Is there context of how the pedestrian was killed? For example, was the pedestrian jaywalking (not using a crosswalk) or was it a drunk driver?
We received numerous questions along these lines. The language in this question is a great example of the lengths that we will go to to blame people walking for being struck and killed, while immediately trying to exonerate the driver of two tons of glass and steel who shoulders the heavier burden of safety. This can be as simple as media reporting that subtly shifts responsibility from a driver to their vehicle, i.e. “a car struck and killed someone walking last night.” Or the immediate quest to find out what the pedestrian was doing so that we might lay the blame at their feet. The fact that it’s become commonplace to assert that someone walking “incited” their own death by wearing a certain shade of clothing or having the audacity to travel at night should be offensive to all of us.
Toxicology is an interesting question. While the FARS database has alcohol test data for some fatalities (less than half in some years), the data is far from comprehensive enough to produce quantitative statements about a trend or reliable national stats. Second, does this fact even matter in the same way for someone walking as it does for someone driving? States enforce blood-alcohol levels that have been determined to make it unsafe to operate a two-ton vehicle that can legally travel at 70 miles per hour because the slightest impairment to your senses is incredibly dangerous. Should we hold people walking at 3 mph on their own two feet to the same standard as we hold people operating heavy machinery moving at 70 mph? It’s just another way that we look to blame the victim instead of addressing the root causes head on.
Do you have data on distracted driving?
Unfortunately, there is no reliable dataset for distracted driving. And it’s a hard thing to measure because it’s often only deduced from driver input (they confess!) or a detailed investigation (pulling phone activity records, witnesses, etc.). We do know that numerous states have passed laws banning the use of phones while driving or passed new hands-free requirements in the last decade, but that smartphone penetration in the market has only become more saturated in that same period. We do know that being distracted can impair a driver just as much as being drunk.
Is it possible to make an interactive map with all pedestrian crashes, not just fatalities?
How do you define serious injuries? Have you calculated the short- and long-term costs to victims (loss of mobility, income, life expectancy)? What about serious/traumatic injuries?
Unfortunately, no. Dangerous by Design analyzes pedestrian fatalities using data provided by the Fatality Analysis Reporting System maintained by NHTSA. Injuries are not included in the dataset. Mapping serious injuries and evaluating their short- and long-term costs would certainly give us a better picture of where crashes are happening and their impacts. However, motor vehicle-related serious injury data is not collected at the national level in the same way as fatality data. In September 2018, the National Transportation Safety Board issued recommendations to three federal agencies (NHTSA, FHWA, and CDC) to work together on creating a national database of traffic-related injuries; however, this recommendation has not yet been implemented.
How can we improve the data that we use to make safety decisions?
Improving state requirements so that the data is consistently collected and reported would go a long way toward improving the FARS dataset. FARS data is reported to NHTSA by states, and therefore there are discrepancies in the dataset that prevent us from getting a full picture at times. For example, many states report a race or ethnicity for nearly all pedestrians involved in motor vehicle-related crashes. However, Pennsylvania is missing almost 90 percent of race and ethnicity data (across the past 10 years), making it difficult to determine whether there are inequities in pedestrian fatality rates in that state. Furthermore, adding serious injuries to the FARS dataset (or a similar reporting system) would allow us to examine where roads are dangerous—not just fatal (see NTSB calling for this above). More robust date could also help us deduce, for example, whether or not fatalities have been increasing while injuries have declined, which could help to confirm the impacts of larger vehicles (trucks and SUVs) that are more likely to kill than injure.
In the past few years, FARS began to collect variables about built environment characteristics surrounding pedestrian fatalities. These include variables such as “the presence of a sidewalk,” “the presence of a crosswalk,” or whether the crash happened in an intersection. These variables are important to our understanding of where and why crashes occur, and should continue to be collected and supplemented when possible.
Why did you use walking trips to work for PDI instead of other methods of measuring walking rates?
This is one of the most frequent questions we get about Dangerous by Design. The simple answer is that the Census Journey to Work data is the most comprehensive data on walking behavior that is available for the entire country at the state and metro level. Using walk to work has many limitations, with the main one being that it does not take into account all trips made by walking. For example, we received a question about whether the walk to work data includes people who walk to transit and then take transit as their primary mode to work—the answer is no, as walking is not counted as their primary mode.
But we do believe that walk to work provides the best proxy of the amount of walking in an area. In a place where a high percentage of people walk to work, they almost certainly take other trips by foot, compared to a place with low walking to work rates. For example, we get many questions about whether more dangerous places are simply warmer and therefore more people are walking. But the PDI accounts for this: preferences based on weather would be reflected in the percentage of people that are walking to work.
When creating the relative scores that assess relative risk across demographic groups (race, age, income, etc.), we use data from the National Household Travel Survey (NHTS). This dataset provides an estimate of the percentage of all trips taken by walking, broken out by race, ethnicity, and age—and therefore provides a more complete assessment of risk. Due to the small sample size of the NHTS, we cannot replicate this method in every state and MSA, and so we continue to use walk to work data as the best available measure for PDI and the overall state/metro rankings.
Could better data collection lead to an increase in fatality numbers? In other words, maybe we have been killing thousands of pedestrians each year, but now we do a better job of counting them?
There’s no indication that better data collection is leading to the increase. States have been reporting using FARS for years now, and there’s zero chance that we’ve been undercounting pedestrian fatalities in some fashion that has now been corrected.
Are we seeing significant changes in the analysis from year to year that should inform how we approach solutions?
The fact that pedestrian deaths on our roads are getting more common (and are likely to continue to do so based on current trends) certainly suggests that we need to elevate our urgency about the problem! Cities and states often know where the most dangerous places are—the places responsible for the lion’s share of fatalities—and they should find ways to make targeted interventions in those places.
Which places are doing things right that other places should take a look at? Which metro areas and/or states reduced their PDI by the most in raw numbers and/or percentage?
As of early 2019, more than 40 cities around the country have committed to Vision Zero, pledging to reduce the number of deaths and serious injuries on their roadways to zero using a combination of strategies, including safer, slower street design. We’ve also been working with cities around the country to implement temporary demonstration projects that not only improve safety, but also engage the community about the importance of prioritizing safer streets. You can read more about the Safe Streets Academy here or check out last year’s case studies here.
Some cities have also been taking innovative approaches to street design to better protect pedestrians. Seattle, for example, recently started "piloting" crosswalks at traffic lights and then measuring their effectiveness rather than putting in a signalized crosswalk only after there is sufficient foot traffic (a strange contradiction that is dictated by the Manual on Uniform Traffic Control Devices).
For a more complete look at how different states and metro areas have changed, download the full report. The appendices contain tables listing states and metros according to the change in PDI from Dangerous by Design 2016.
How can we work with private developers to enhance pedestrian safety approaching their private development? Government agencies and private developers use the ITE Trip Generation Manual to decide the development impact, which is almost entirely dedicated to improvements related to vehicle impact from the private development. The manual currently covers very little regarding walk/bike trips for private developments.
You are right. Conventional transportation impact mitigation is largely devoted to auto facilities, which can degrade the experience for other modes, such as walking. However, some cities have moved away from auto-based mitigation. A recent statutory change in California (SB 743) has catalyzed innovation in this area, building on practices from cities around the country. Rather than requiring auto facilities, they push developers to minimize single-occupancy vehicle trips through the land-use mix and transportation-demand management (TDM) measures, including provision of non-auto modes.
SGA’s State Smart Transportation Initiative covers this in a recent report, Modernizing Mitigation. If you want to follow up, you can find SSTI staff contact info at www.ssti.us.
Do micromobility facilities improve or hinder pedestrian safety?
The short answer is that it’s just too early to measure the impact in any concrete way. But the rise of micromobility services—like dockless bikes and shared electric scooters—is spurring a valuable and necessary conversation about how to design streets to better serve the needs of everyone who needs to use them. (For those of you working at the municipal level in some fashion, see the new Shared Micromobility Playbook from our colleagues at Transportation for America.) But we should devote the most attention to the most pressing issues. Certainly, scooters operated on busy sidewalks could be somewhat hazardous to people walking, but there’s still nothing more dangerous for people walking than streets that don’t take their needs into account, and people driving cars (at high speeds) on those streets.
- How are the states and the federal government going to pay for all of these needed improvements for safe streets when the reality is that the federal government is cutting back on financial support to many states that need those federal dollars to offset transit and other public transportation funding needs?
- What is the incentive for states to lower their target goal of pedestrian fatalities?
As Transportation for America explained in more detail, states were required by Congress to create annual targets for pedestrian fatalities, and 18 states (including 10 of the most deadly) set targets for 2018 that were actually higher than the previous year. They planned for fatalities to increase.
The short answer to the second question is that states do not have an incentive, and this is a problem that Congress needs to fix in the next transportation reauthorization in 2020. This is the major flaw in the system that Congress created and implemented. States told Congress that they wanted more flexibility for their federal transportation dollars, and in exchange, states would provide more transparency and accountability for how they spend those dollars. But Congress created a system where states can ignore their safety needs while continuing to spend their money designing new roads that will ensure more deaths in the future. States are making Congress look like fools, and Congress needs to fix this mistake and hold states accountable to prioritize safety with the billions they get each year in federal transportation dollars.
As to the first question above, the truth is that states have plenty of money to address these problems, but lack the will to the safety of vulnerable road users top priority. The rhetoric may say so, but their budgets tell a different story. That’s why simply increasing federal transportation spending will fail to fix the problem if we don’t have the right priorities in place.
Can you share the Florida policy document that anticipated and planned for an increase in traffic deaths?
The safety targets referenced in Dangerous by Design come from Florida's 2017 annual report for the Highway Safety Improvement Program (HSIP), accessible here. Note that the non-motorized fatalities and serious injuries safety target on page 44 exceeds the most recent year of data reported for these indicators on page 29.
Can you put up a list of the speaker names or point me to a website that lists their names and organizations?
Emiko Atherton, Director, National Complete Streets Coalition
DeAnza Valencia, Advocacy Representative, AARP New Mexico
Nedra Deadwyler, Founder, Civil Bikes
Billy Hattaway, Director of Transportation, City of Orlando, Florida
- What are some creative ways to funnel funds specifically for bike/walk safety in low-income communities and communities of color?
- What community engagement methods have been utilized to educate and engage low-income minority communities and residents?
- Are there example policies that we can look at that address keeping people in place around new bikeable/walkable infrastructure?
When it comes to reversing decades of systematic underinvestment in low-income communities and communities of color, we need formal policy changes and commitments to make these vulnerable users a higher priority. One recent example of a place that has established such a commitment is the City of Baltimore, whose recently adopted Complete Streets ordinance establishes new project selection criteria that will intentionally and systematically prioritize projects that improve safety in underinvested communities, including places with low rates of car ownership. But simply implementing more projects in these communities is not enough if those projects do not satisfy the needs and desires of the current residents. Baltimore’s ordinance also calls for more inclusive community engagement. Whether this means holding pop-up meetings at convenient times and locations where people already gather or ensuring listening sessions are interactive and inviting to participants, equitable community engagement requires us to be intentional and proactive about letting the existing community guide the vision of projects.
However, even if we prioritize investments in low-income communities and communities of color and ensure through inclusive, proactive community engagement that these projects are culturally relevant to the existing community, we must also acknowledge that making these necessary improvements can increase the risk of unintentional displacement. More proactive housing policies and support programs can help keep existing businesses and residents in place. For a broader discussion on how affordable housing, economic opportunity, and land use policies can help mitigate or prevent displacement, we recommend PolicyLink’s Equitable Development Toolkit.
Related News


Livable places. Healthy people. Shared prosperity.


© 2026 Smart Growth America. All rights reserved
Site By3Lane Marketing
