


Resource
Dangerous by Design 2019

Dangerous by Design 2019
Between 2008 and 2017, drivers struck and killed 49,340 people who were walking on streets all across the United States. That’s more than 13 people per day, or one person every hour and 46 minutes. It’s the equivalent of a jumbo jet full of people crashing—with no survivors—every single month.
In the past decade, the number of people struck and killed while walking increased by 35 percent. 2016 and 2017 were the two highest years since 1990 for the number of people who were killed by drivers while walking.
This report ranks states and metropolitan areas around the country using our “Pedestrian Danger Index”, or PDI. This index measures how deadly it is for people to walk based on the number of people struck and killed by drivers while walking, controlling for the number of people that live in that state or metro area and the share of people who walk to work. The 2019 edition of Dangerous by Design includes traffic deaths that occurred between 2008 and 2017 from the Fatality Analysis Reporting System (FARS), a national database of all fatal traffic crashes.
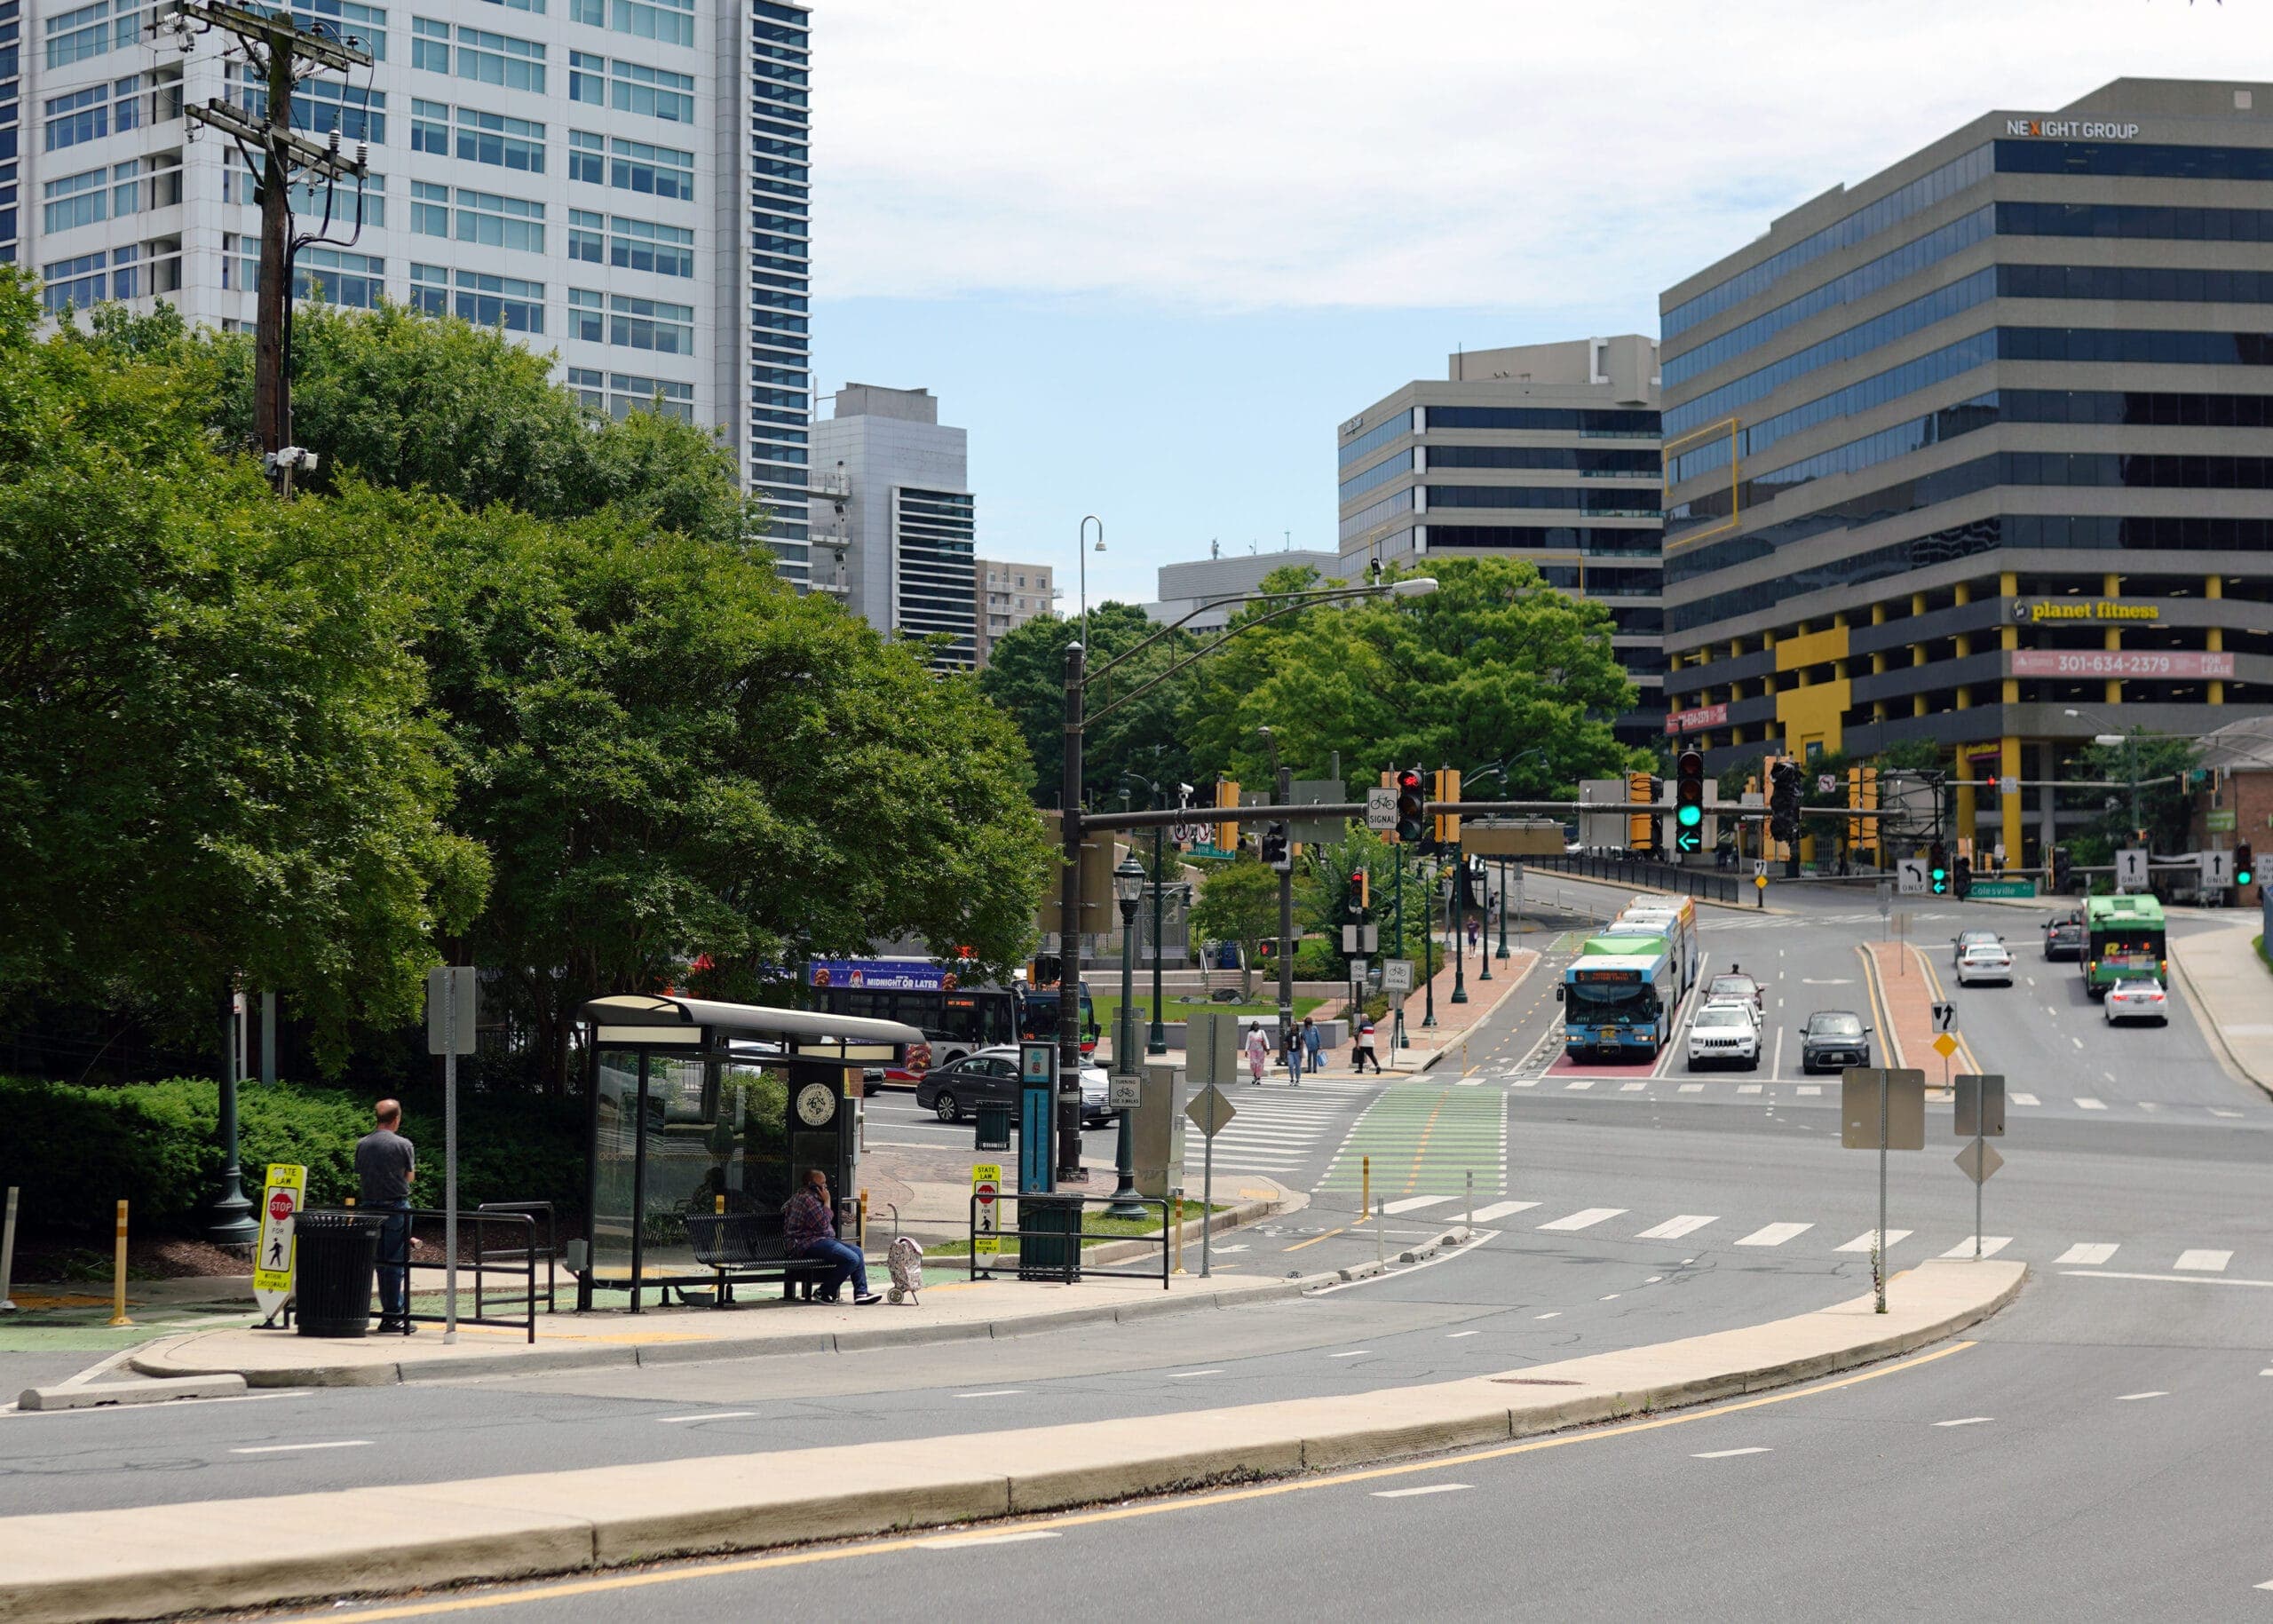
What this report shows is that our streets aren’t getting safer. Even more so, while traffic deaths impact every community in the United States, states and metropolitan areas across the southern continental United States, older adults, people of color, and people walking in low-income communities bear a higher share of this harm.
This report is accompanied by an interactive maps of pedestrian fatalities from the period in the report as well as sortable tables of all state- and metro-level data. View the additional resources:
Related Resources


Dangerous by Design 2016
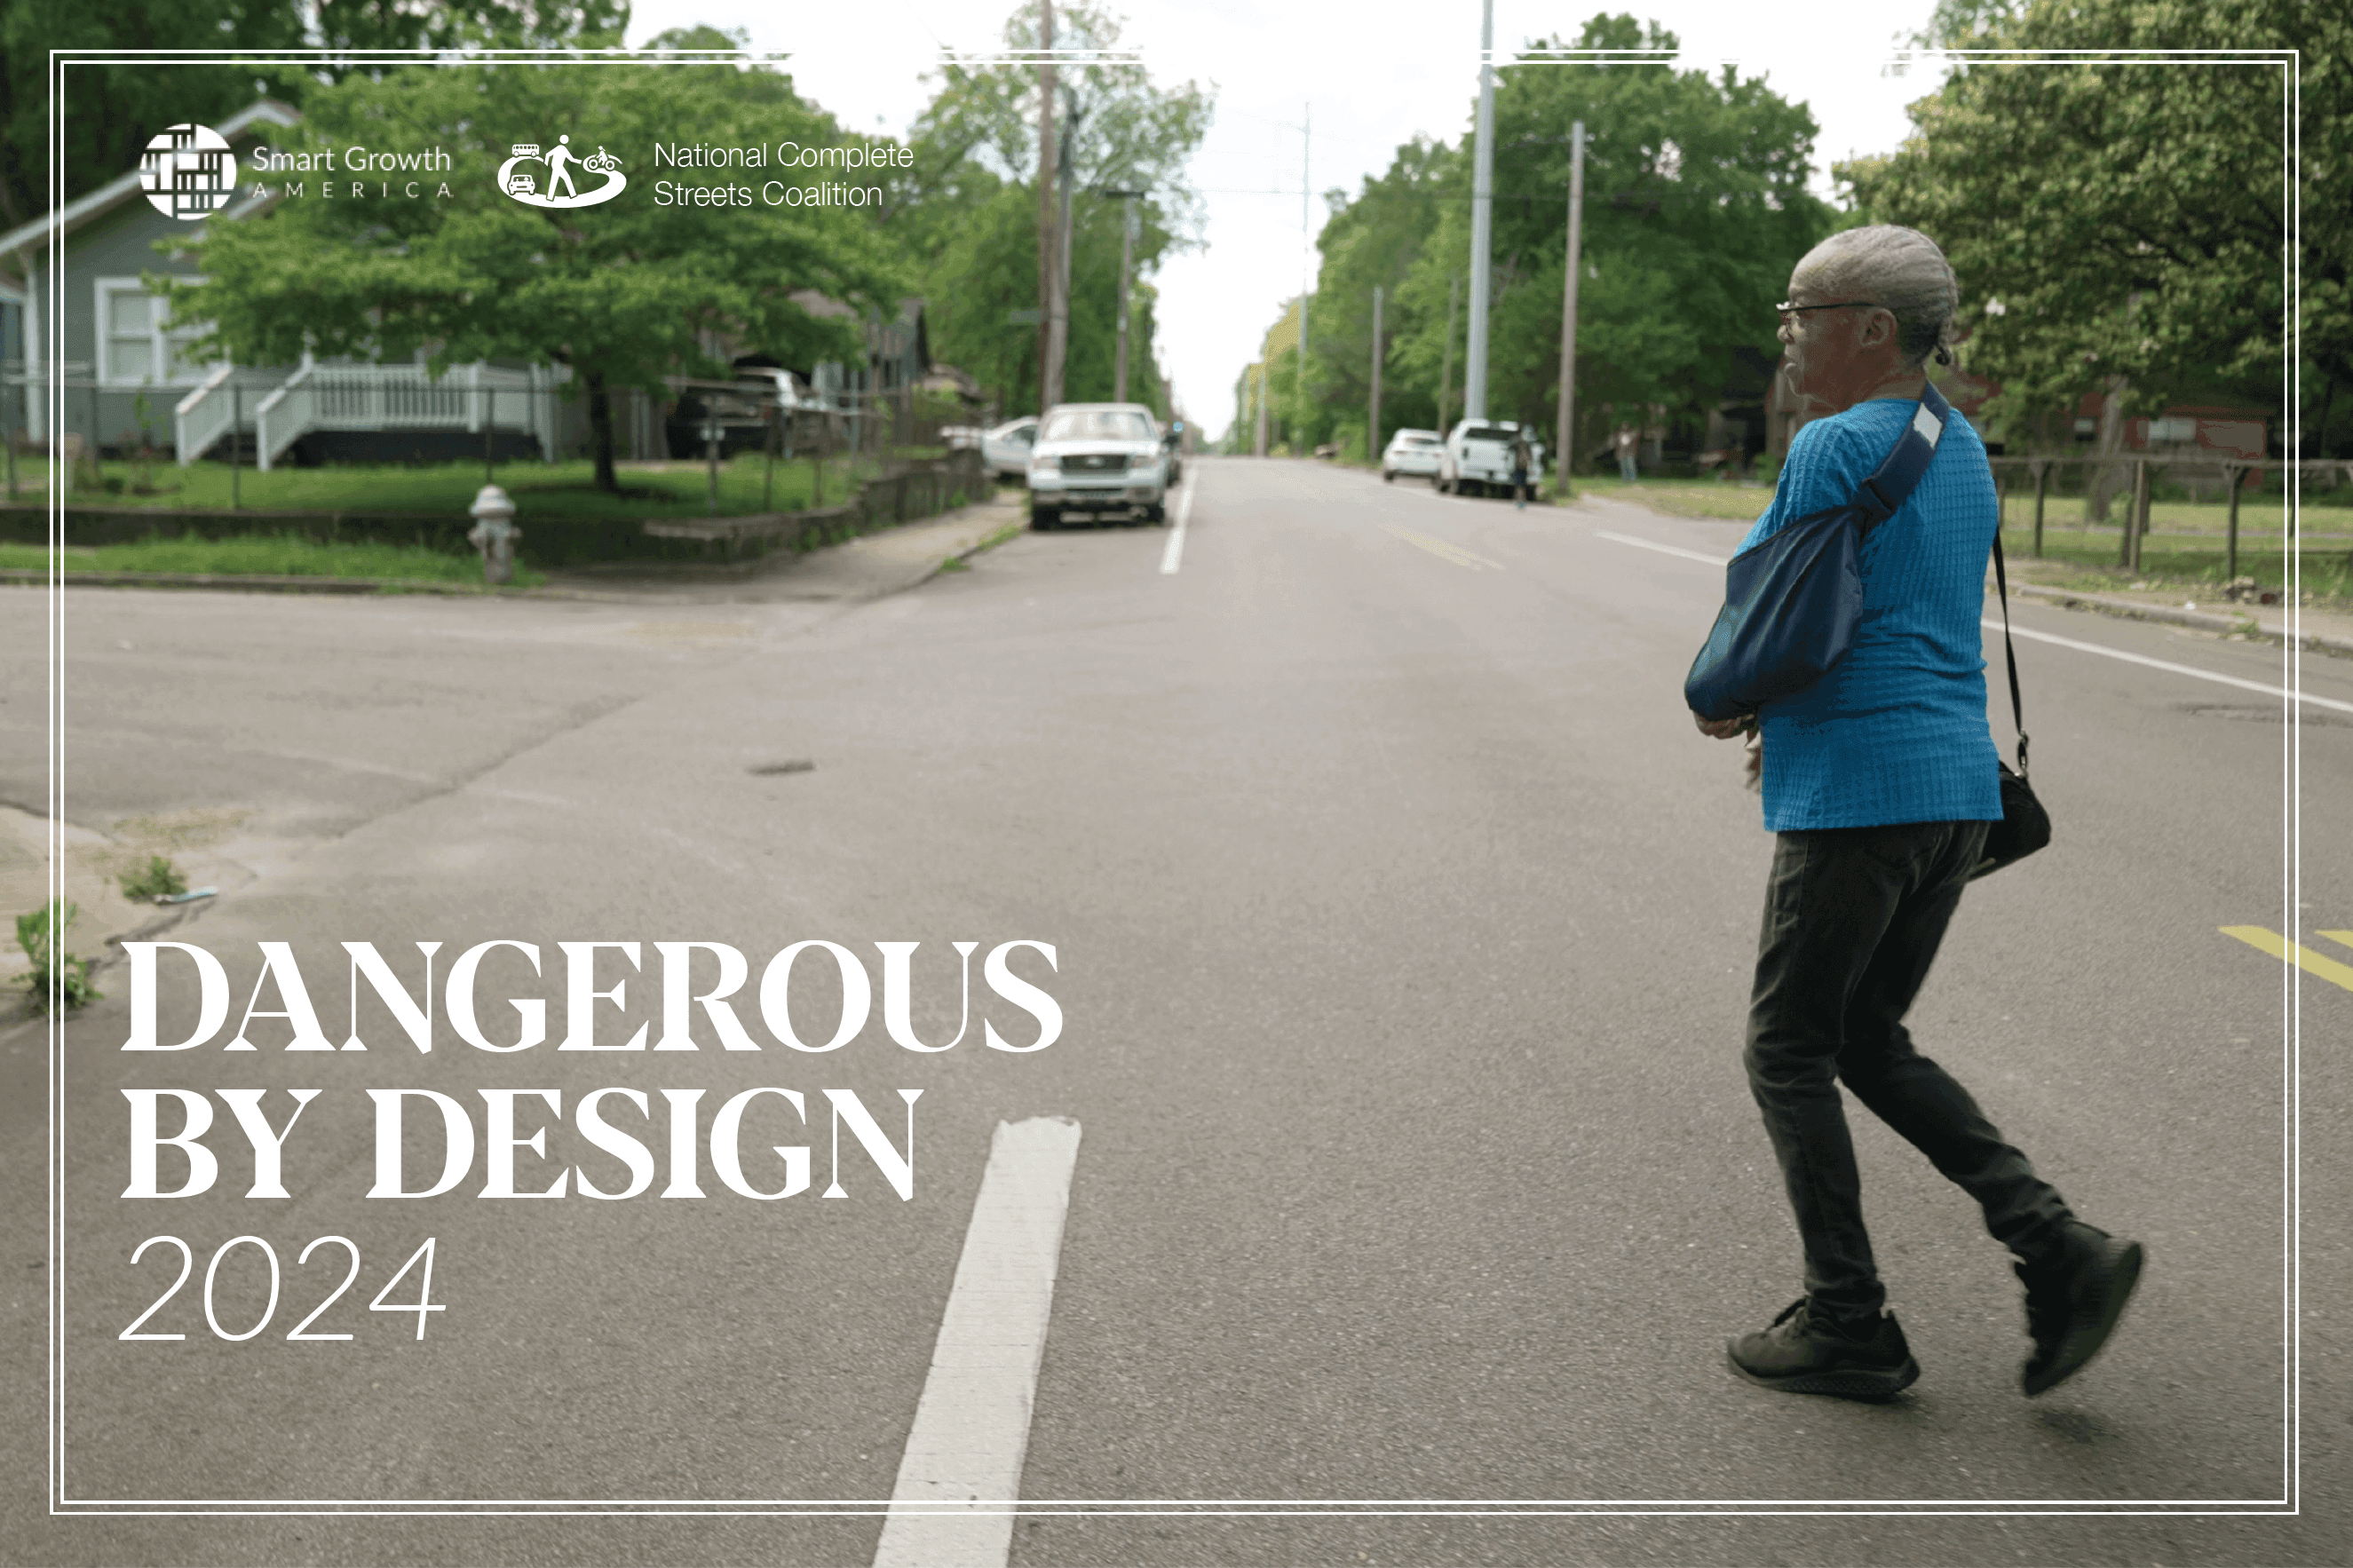
Dangerous by Design 2024

Dangerous By Design 2021

Dangerous by Design 2014

Dangerous by Design 2011
Livable places. Healthy people. Shared prosperity.


© 2026 Smart Growth America. All rights reserved
Site By3Lane Marketing
