


News
By Steve Davis, April 17, 2023
Last week, the U.S. Department of Transportation (USDOT) released final data for 2021 revealing that drivers of motor vehicles struck and killed 7,341 people while walking that year. This massive 12.4 percent increase over 2020 is both higher than predicted and illustrative of the urgent need for a better approach to gathering and collecting this data. We can’t say we care about a crisis that we are failing to measure well.
Fifteen months have passed since the end of 2021, we’re almost a month into spring 2023, and we’re just now seeing final 2021 numbers. USDOT released these figures this week after states reported them to federal agencies, including the National Highway Traffic and Safety Administration (NHTSA), who then organized and cleaned up the data.
2021 was more deadly than all of the estimates
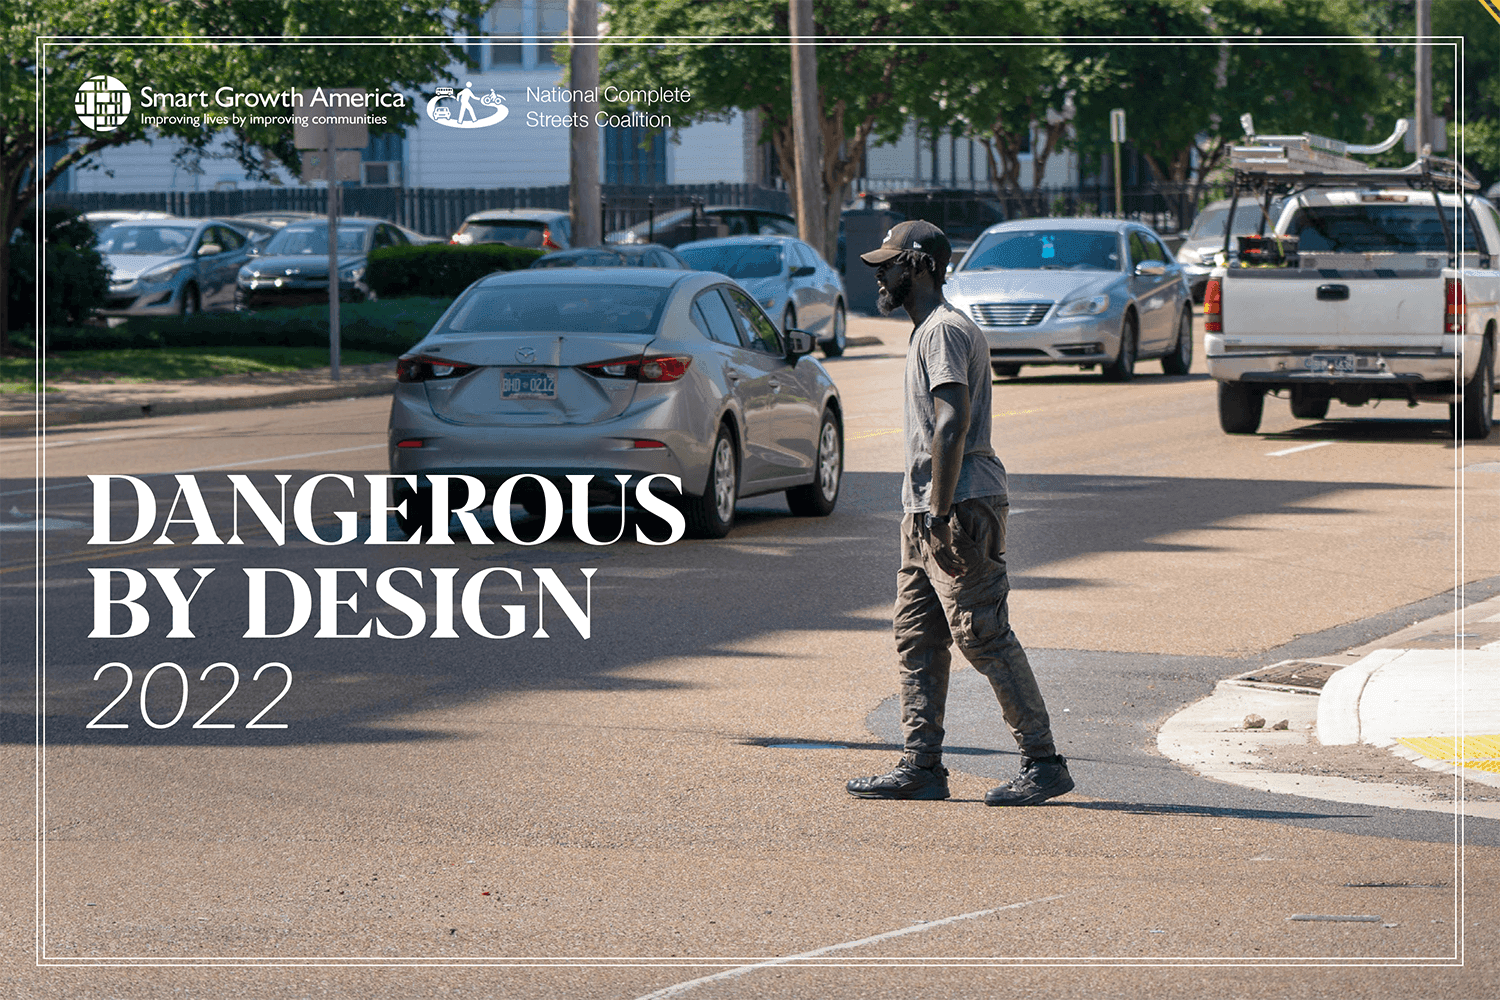
When we released the last edition of Dangerous by Design in 2022, we only had data through 2020 and had to estimate the number of people struck and killed while walking in 2021.
How? The Governors Highway Safety Association (GHSA) provides incredibly helpful estimates for traffic fatalities well before the full official data is ready. In the case of GHSA, their role as the hub for state highway safety officers gives them the ability to provide reasonably accurate estimates, though they count fatalities slightly differently. We used GHSA’s estimated 11.5 percent increase in pedestrian deaths from 2020 to 2021 and applied it to the final federal numbers for 2020, reaching an estimate of 7,265 people struck and killed while walking in 2021.
The reality is even worse, with USDOT now reporting 7,341 people struck and killed while walking in 2021. That’s a 12.4 percent increase over 2020, a full point higher than the estimate we used from GHSA. Here’s an updated graphic:
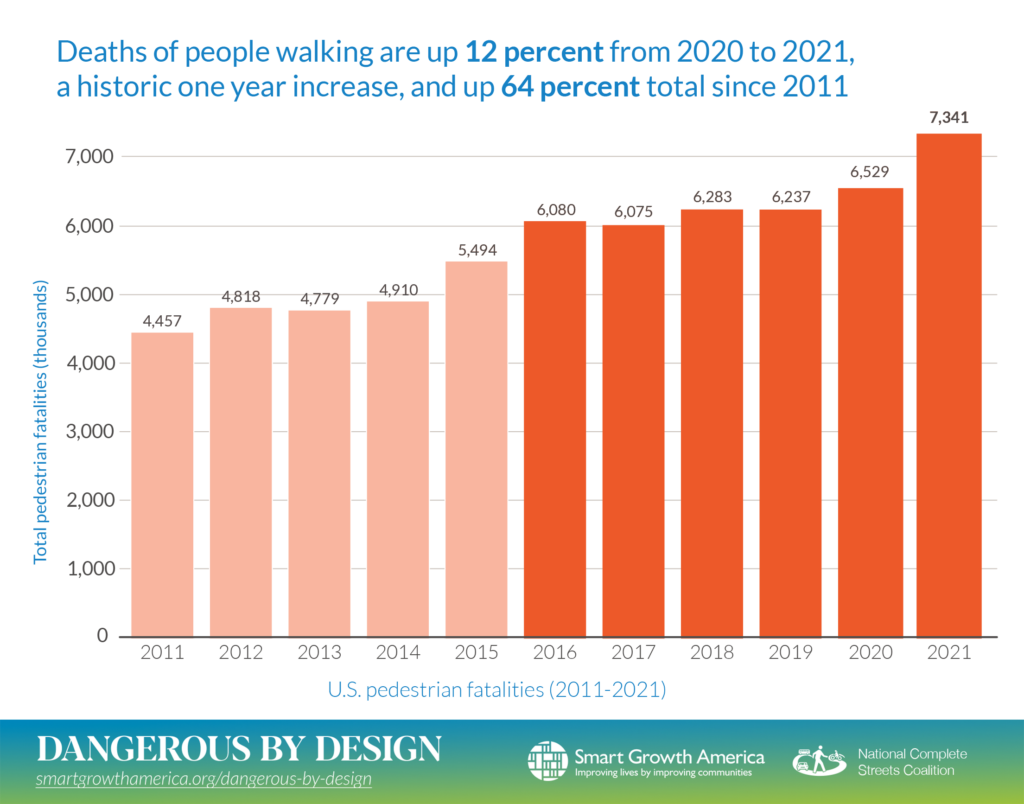
We also need to remember who bears the heaviest burden when it comes to the toll of these 7,341 deaths: people of color and those walking in lower-income areas. If you are Black or live in a low-income neighborhood, then you are far more likely to have first or second hand experience with the death of someone close to you.
Why does this data set take so long to produce?
Up until a few years ago, it took about 9-10 months to provide the full highway safety data set in searchable form, meaning it would be available by October of the following year. Over these months, the data was collected, reviewed and corrected, and put into a searchable database for the public to access.
As someone who has worked closely on Dangerous by Design reports for more than a decade, it’s worth noting that the time lag has grown worse in recent years. Data released in October allowed us to release a new version of Dangerous by Design as early as January of the following year. That lag has grown to about 15 months over the past few years, and the last Dangerous by Design didn’t release until summer 2022 as a result, with comprehensive findings only through 2020. It is not at all clear why it is suddenly taking so much longer, if those reasons are temporary or permanent, and NHTSA has not addressed it publicly.
The number of people struck and killed while walking has nearly doubled since the late 2000s, yet we seem to have no better idea about what safety is actually like in the present moment on our streets. It is hard for safety and transportation agencies at almost any level to tackle the root causes of this epidemic when our picture of the crisis is always 15 months out of date.
USDOT and NHTSA need to be more transparent about how they produce this data and explain exactly why it takes so long—so that Congress, states, and advocates can work with them to address those issues. Is it a problem of money or administrative capacity? Is there a more structural problem with how the data is gathered by states and reported to USDOT? The scope of this preventable crisis of people being struck and killed on our roadways likely requires a fresh approach to both gathering and releasing this data.
Even if it comes faster, we’re also badly in need of better data overall, which is an area where USDOT should lead the discussion. The limitations of the data are something we touch on in nearly every edition of Dangerous by Design (p.15 in the 2022 report):
We can’t properly evaluate safety without better, more comprehensive, and timely data. … FARS data also fails to properly account for fatalities involving people with disabilities. While NHTSA recently made some improvements here, wheelchair and scooter users are still inappropriately grouped with road users like skateboarders and roller skaters. It’s incredibly hard to evaluate safety with data that are never current and which fail to capture the full picture of who is harmed, where, and how. Local crash reporting that feeds into FARS has major issues too, such as a significant share of fatalities without race or ethnicity recorded, making it difficult to evaluate disparities with who is at greatest risk.
The pandemic also showed that we need better data on walking trips overall. Transportation agencies focus almost exclusively on trips to work. But the work trip is a small minority of trips—even more so since COVID-19. Collecting comprehensive data on walking (similar to data from StreetLight Data we tap in this report) would help us measure the extent to which pedestrians are exposed to traffic danger. We can’t say we care about a group of travelers that aren’t counted.
New federal tool for assessing data is worth celebrating
We pulled this data from a powerful and more user-friendly tool for filtering and analyzing fatality data which is worth celebrating, though it’s still a little buried on USDOT and NHTSA’s website. USDOT has released FIRST, the Fatality and Injury Reporting System Tool. This doesn’t replace the old Fatality Analysis Reporting System (FARS) which is the source of all traffic fatality data but rather provides a much simpler way to construct customized queries of FARS and the Crash Report Sampling System (CRSS) at once.
This is where we pulled the data for 2021 and speaking from experience, it’s far easier to use than the query tool associated with FARS. This is a victory for transparency and governmental openness and we hope that NHTSA and USDOT will start profiling it far more prominently in their outreach and on their website.
Data issues aside, a 12 percent increase is astonishing
Enough about the data itself, which shouldn’t distract from the most arresting headline here: 7,341 souls. A 12 percent increase in just one year, the highest single-year jump in recent history. (Comparing 2021 to 2019, when travel behavior was more similar to 2021 than the shutdown-laden year of 2020, that increase goes up to an astonishing 17 percent.)
Whatever constitutes our approach to safety in this country, it is a total failure. We are failing the victims, we are failing their friends and loved ones who have to press on after these traumatic incidents, and we are failing our communities who have to bear the financial and non-financial costs of these crashes and deaths—to say nothing of all the near misses.
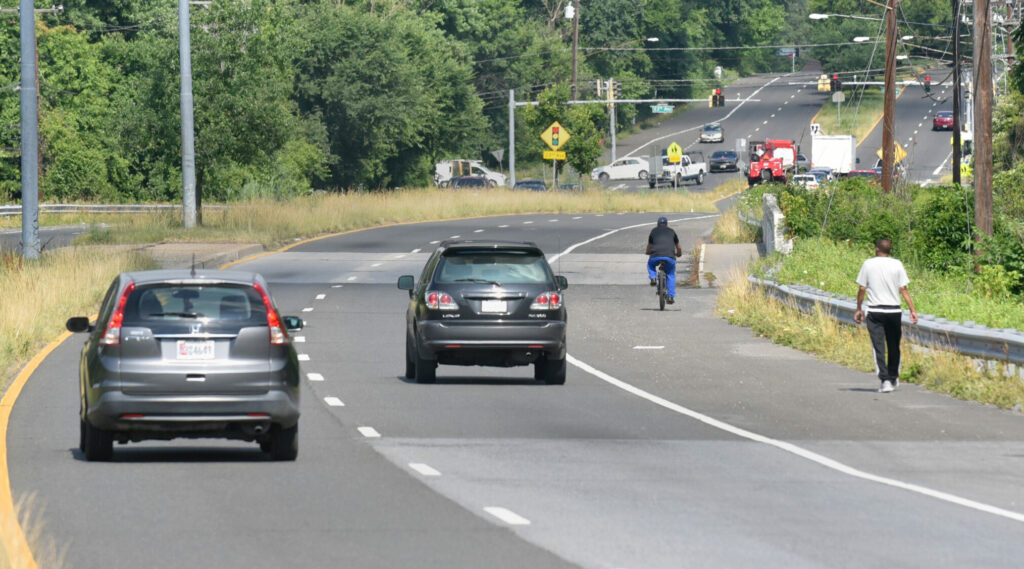
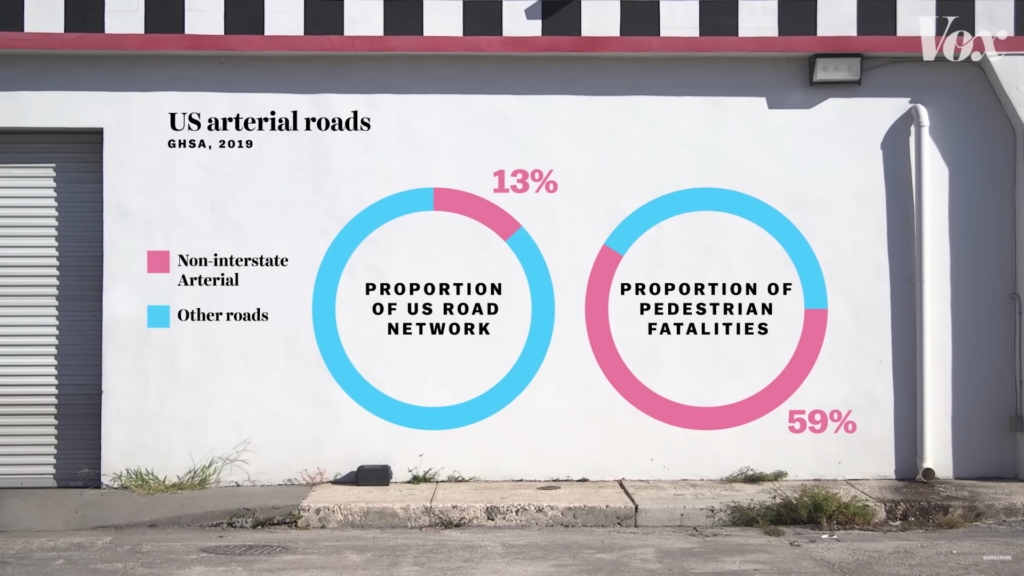
There have been some major improvements in our approach to safety, but if the numbers don’t bear it out, is it truly enough? All of the new safety and people-first programs in the infrastructure law (the IIJA) represent the most notable improvements Congress has made since 1991. But these small programs still represent a fraction of overall spending, the status quo is still firmly entrenched, and states—which control the most dangerous streets (arterials)—are still free to give only lip service to safety.
Screengrab from this Vox video, which was a companion piece to this original story: The deadliest road in America.
States still use outdated design guidance (with the blessing of or sometimes even through USDOT requirements). They are the ones using decades-old models and measures that prioritize speed over safety, even when “safety is always the top priority.”
It’s not hard to argue that NHTSA—the agency charged with safety as its primary responsibility—has been asleep at the switch during this decade-plus increase in deaths, as law professor Greg Shill lays out clearly in this paper:
Thrilled to share "Regulating the Pedestrian Safety Crisis," just published
The motivation was simple: ped deaths are up 50%+ since 2010, but @NHTSAgov is the only responsible agency that has failed even to notionally prioritize pedestrian safety. Short 🧵https://t.co/QgrMe9zYSL pic.twitter.com/NFkFRNpwjB
— Greg Shill (@greg_shill) December 7, 2022
While USDOT has made some welcome improvements, creating a new hub of resources for Complete Streets and guides that explain potential ways to make dangerous arterials safer, these are still just suggested resources and optional guidance. USDOT needs to make these the standard in their own rules, guidance docs, and design standards/guidelines, such as the MUTCD and Green Book which states use to govern the design of their streets.
When it comes to making tangible changes to protect the most vulnerable people on our roadways, the level of urgency needs to match the scale of the crisis. Whether that’s better data, changes to the design standards, or penalties for states that ignore the crisis, we can’t keep sitting by and watching 10 or 12 or 15 percent increases in these deaths each year. It’s simply unacceptable.
Related News


Livable places. Healthy people. Shared prosperity.


© 2026 Smart Growth America. All rights reserved
Site By3Lane Marketing
