


Resource
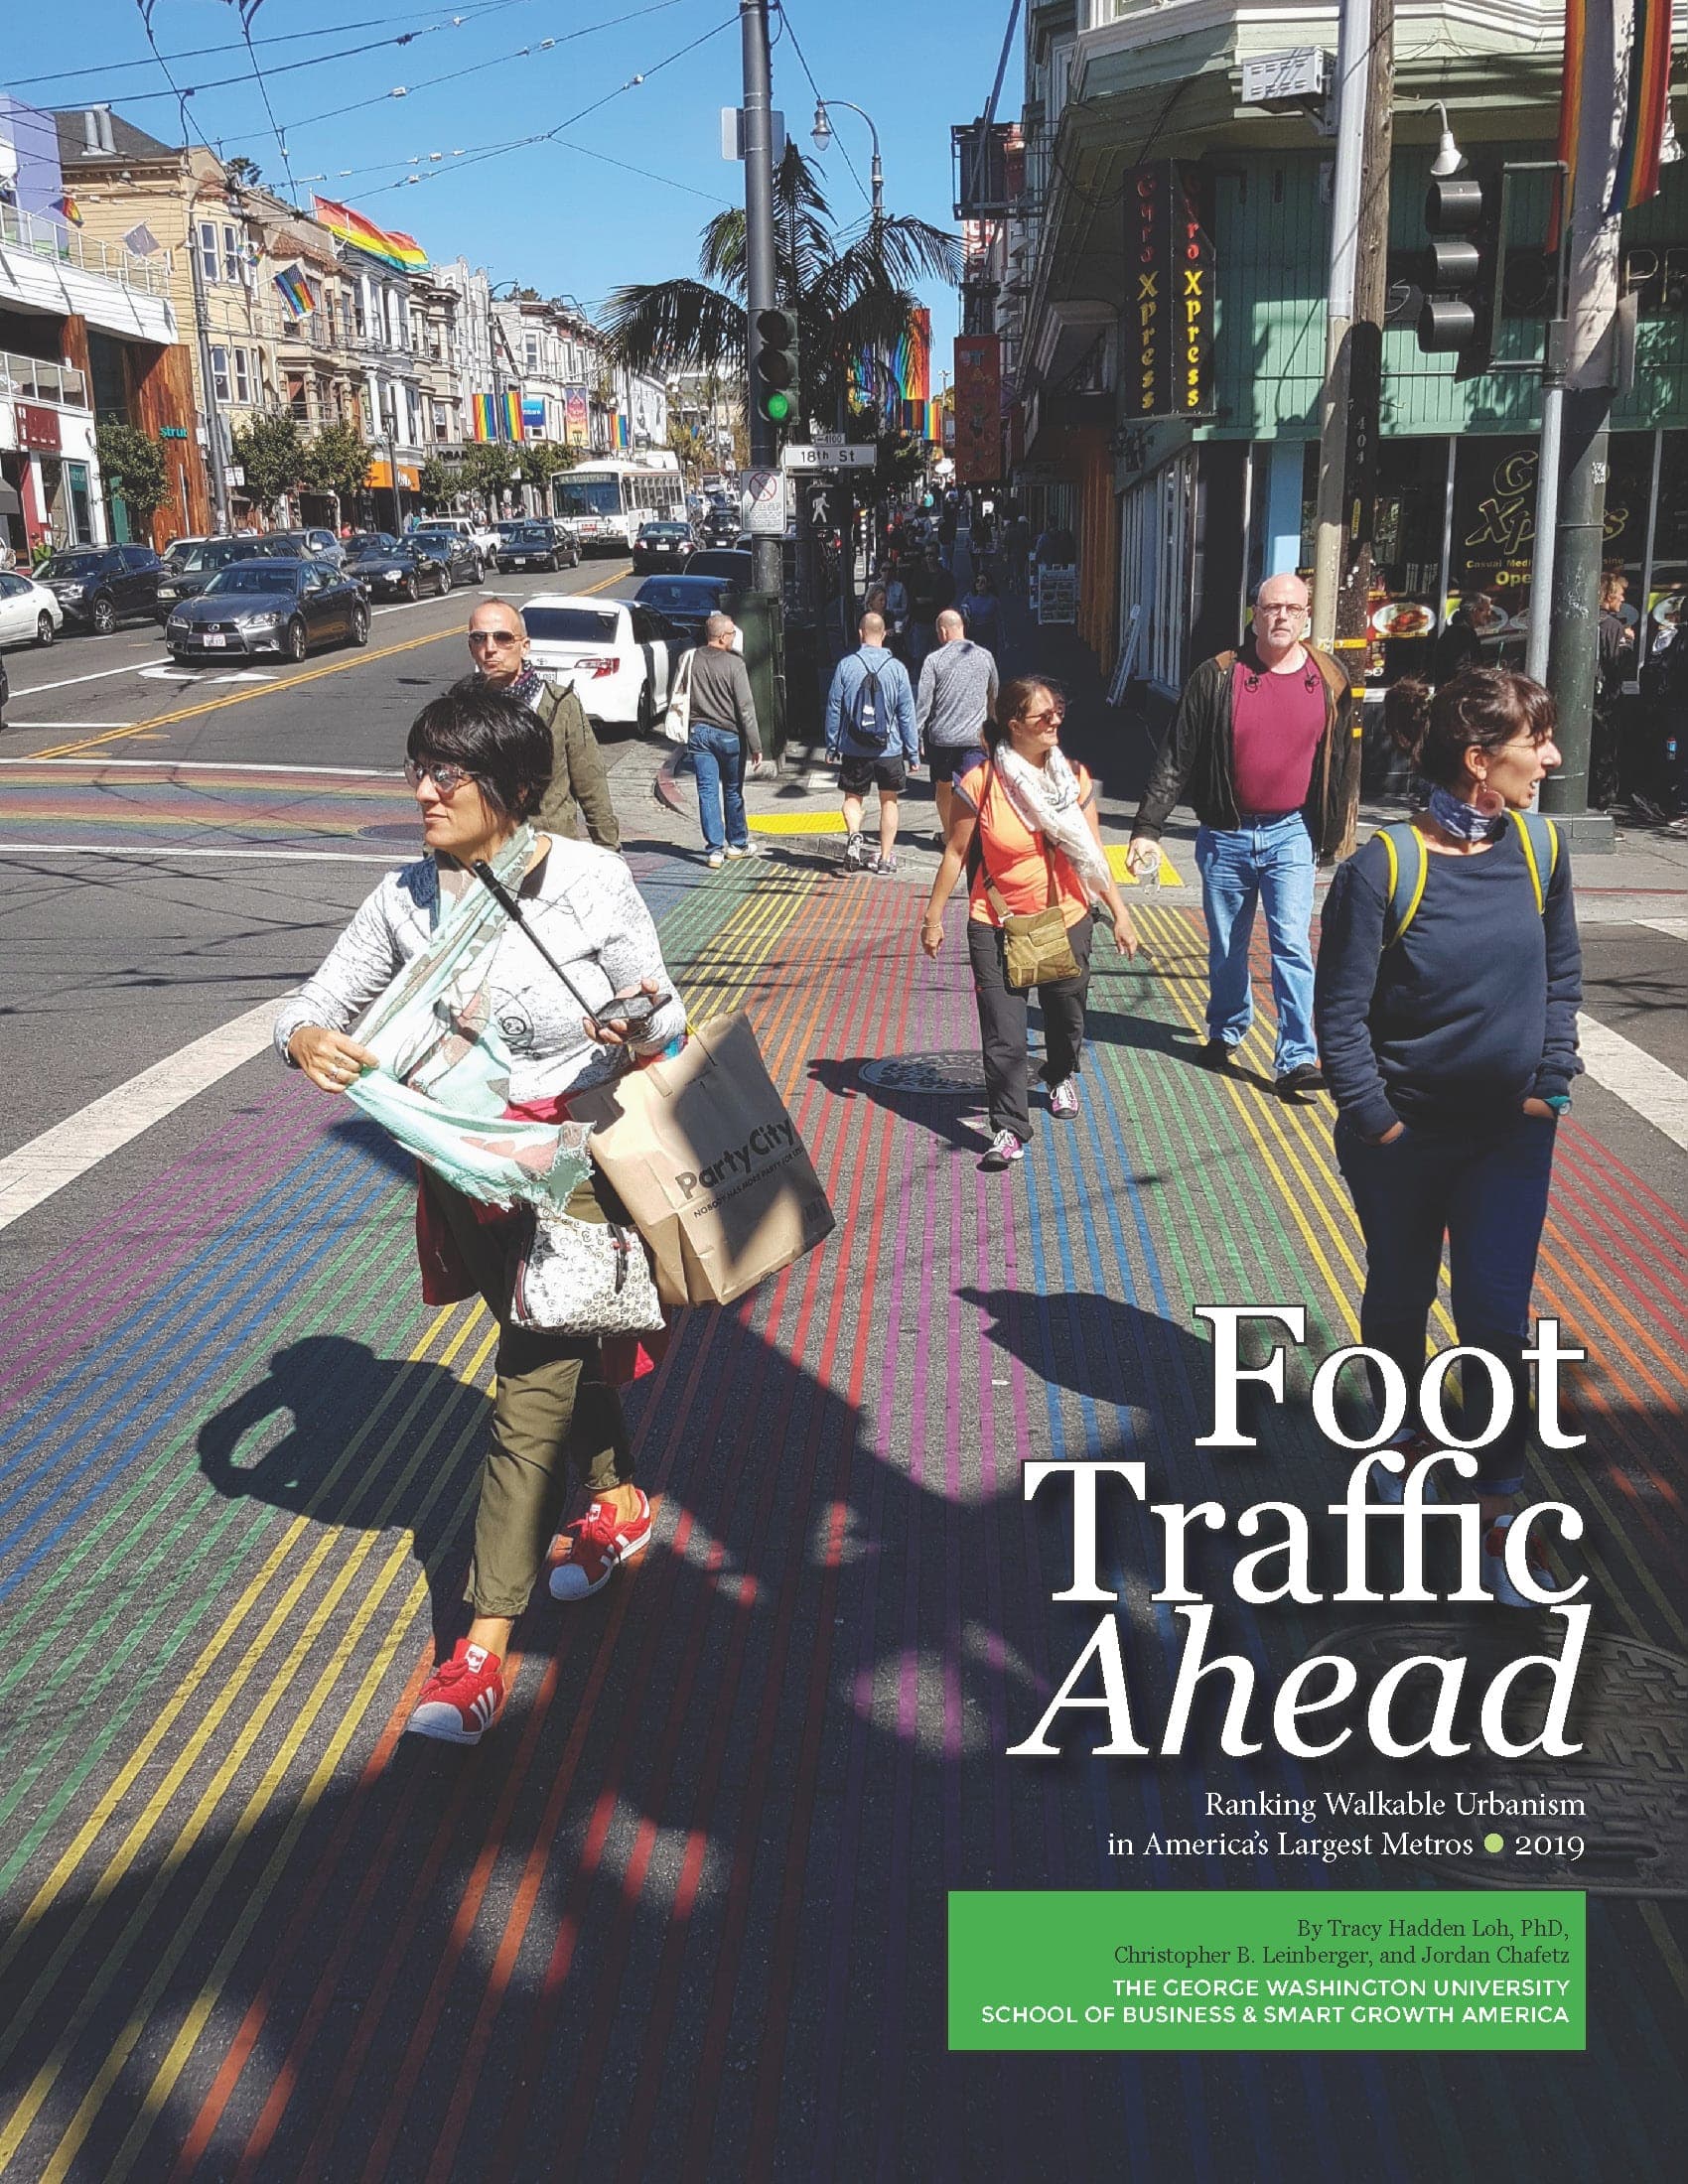
Foot Traffic Ahead 2023

Foot Traffic Ahead 2023
Foot Traffic Ahead 2023 ranks the top 35 metro areas by their walkable urbanism using an index that considers premiums in commercial rents, multifamily rental rates, and for-sale home prices. Co-authored by Michael Rodriguez, AICP, and Christopher B. Leinberger, and using data from Yardi Matrix and Rocktop Partners, the report finds that the demand for walkable urban real estate far exceeds supply. Read our press release here.
Foot Traffic Ahead finds higher demand driving premiums for commercial and multifamily rents and for-sale home prices in walkable urban places, compared to car-dependent alternatives.
Based on the share of office, retail, and rental multi-family occupied square footage in walkable urban places relative to the metro region as a whole, the top regions are 1) New York City, 2) Boston, Boston, 3) Washington, DC, 4) Seattle, 5) Portland, 6) San Francisco, 7) Chicago, 8) Los Angeles.
The report also provides policymakers with recommendations on how to increase both the supply of and access to equitable, walkable urban development while safeguarding affordability and providing benefits such as improving community health, lowering emissions by reducing car use, and advancing equity by bringing access to economic opportunity.
Read our recommendations, here.
Findings
The report found that 19.1% of the total U.S. real GDP and 6.8% of the US population are located in walkable urban places that represent just 1.2% of total landmass of the top 35 US metros. This is notable as it is illegal to build walkable urban densities and mixed-use development on much of the 98.8% of land that is car-dependent due to restrictive zoning policies in most metropolitan areas. Tools to address high prices and short supply include zoning reform to increase walkable urban land supply and expansion and investment in affordable housing.
Foot Traffic Ahead did find modest reductions in the walkable urban rent and for-sale price premiums over drivable sub-urban due to the pandemic, a “bump in the road”, but significant price premiums remain across the board for walkable urban real estate, including 34% price per square foot price premiums in residential for-sale and 47% rental premiums in office and multifamily rentals.
The report’s future momentum index identifies which metro areas are growing their share of walkable urbanism, promising increased walkable urban development in the future.
Social Equity
This report also ranks the metro areas on social equity by three dimensions—affordability, transit, and proximity to walkability for different socioeconomic and racial groups—finding that there is not an inherent tradeoff between walkable urban places and equitable access to walkable neighborhoods. For example, New York and Washington, D.C. rank in the top 10 of both our walkable urban and social equity rankings. In contrast, Portland and Los Angeles are also in the top 10 of our walkability rankings but in the bottom 10 of our social equity rankings.
The top metro areas in our Social Equity Index are 1) Cleveland, 2) New York, 3) Kansas City, 4) Detroit, 5) Philadelphia, 6) Pittsburgh, 7) Baltimore, 8) Washington, DC
New in Foot Traffic Ahead 2023
Metrics study walkable neighborhoods (Type 2)
This is our first report studying neighborhood-centered walkable areas in suburbs and areas outside downtown cores. These present an opportunity to grow walkable urbanism.
Recommendations for Equitable Development
This report recommends key opportunities for metropolitan areas to increase walkability and equitable access to it, as well as reduce barriers to developing mixed-use, walkable places.
Related Resources


Foot Traffic Ahead: 2014

Foot Traffic Ahead: 2016
Foot Traffic Ahead: 2019

Foot Traffic Ahead
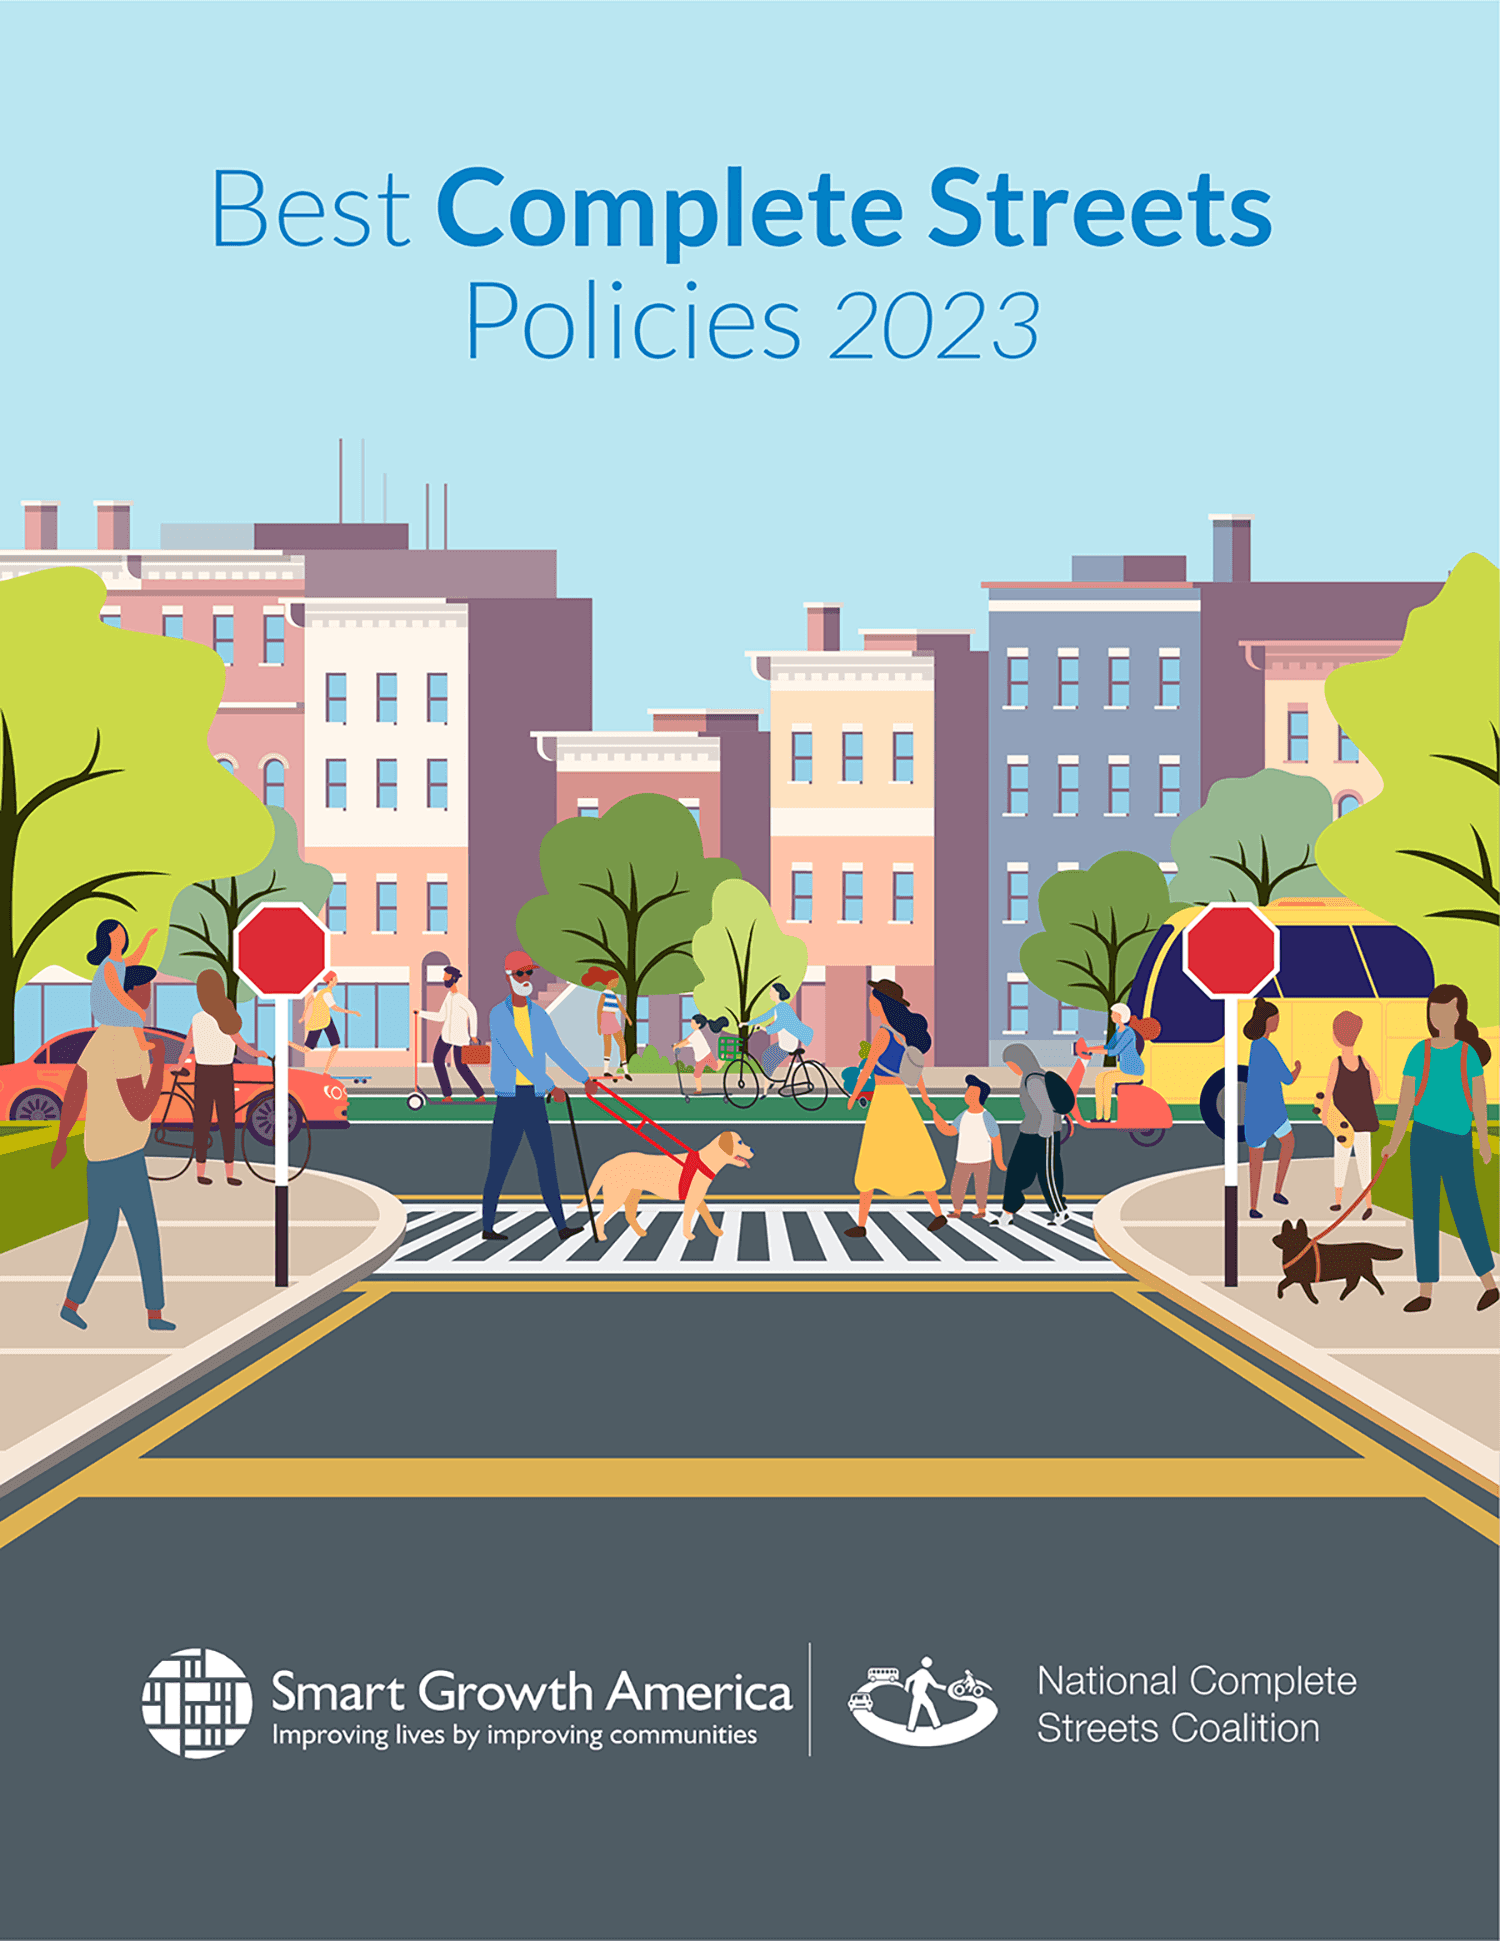
The Best Complete Streets Policies 2023
Livable places. Healthy people. Shared prosperity.


© 2026 Smart Growth America. All rights reserved
Site By3Lane Marketing
