


News
By Eric Cova, April 4, 2024
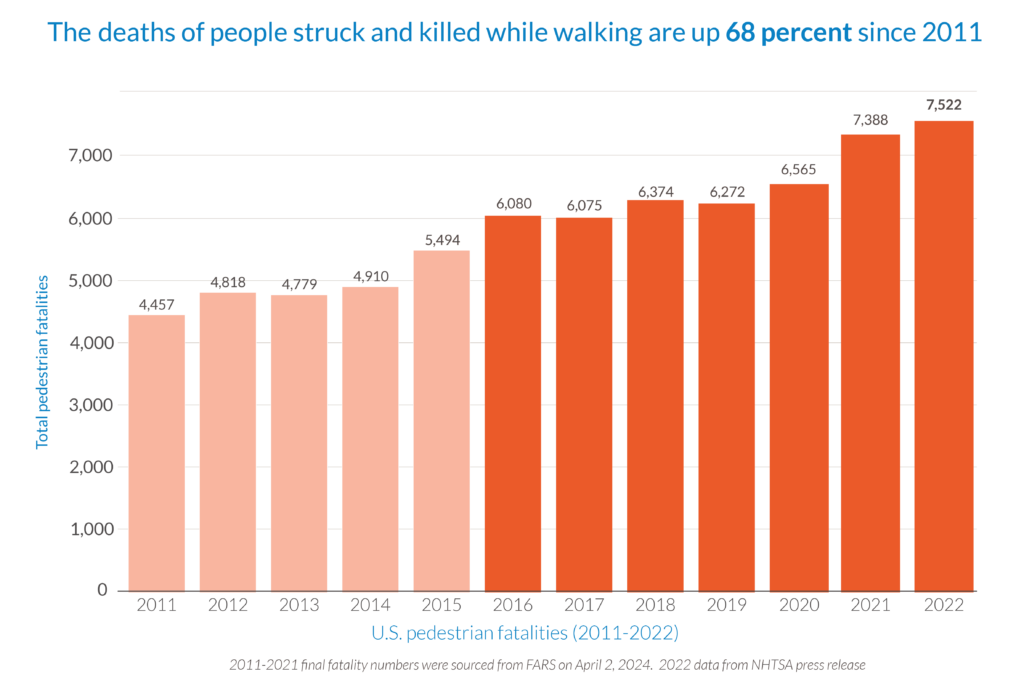
Yesterday, the U.S. Department of Transportation (USDOT) released final data for 2022 traffic crashes revealing 7,522 people were struck and killed while walking that year. This crisis isn’t new—pedestrian fatalities are on a consistent upward trajectory and have increased by 68 percent since 2011. We need strong leadership and swift, wholesale action to make our streets safer for everyone who uses them.
You might have missed it (we almost did), but 15 months after the end of 2022, the 2022 traffic crash data is finally out. And while traffic fatalities decreased overall, there’s no cause for celebration—pedestrian fatalities increased once again to historic levels and our roads continue to grow more dangerous for people outside of cars.
In the week since the Key Bridge collapsed and tragically killed six construction workers, more than 165 people walking could have died, according to average rates from 2022. To save lives, we need a wholesale systems-level approach to combating the traffic safety crisis, accompanied by the kind of urgency we’ve all seen in the wake of last week’s awful tragedy in Baltimore.
Our current piecemeal efforts to tackle the crisis are failing to produce safer streets with fewer deaths and injuries. Here are five data points that explain why:
Defining the problem
1. Pedestrian fatalities are up again, the highest levels we’ve seen in 40 years—and a nearly 70 percent increase since 2011.
In 2022, 7,522 pedestrians were struck and killed by cars. This is roughly the equivalent of:
- The population of a small town, say Buena Vista, Colorado.
- The student population of Gonzaga University.
- More than three Boeing 737s falling from the sky every month for a year.
It’s not just deaths that are going up. In 2022 the number of pedestrians injured by traffic violence increased 11 percent over 2021. And while the numbers alone should move us into action, they do not tell the whole story. Each number represents a life of vital members of our community. A mom, dad, sister, brother… a child.
2. Injuries and deaths are up for cyclists too
According to the data, Cyclist deaths increased by 13 percent to 1,105 people killed by cars in 2022, and reported injuries increased by 11 percent to more than 46,000 (thousand!). And despite proven methods to reduce death and injury to bicyclists (risk of injury when riding in a protected bike lane drops by 50% and has safety benefits for all modes), many cities either choose not to install these measures or consider removing them outright. It’s bad enough when action isn’t taken, but to have the hard work of advocates and local champions reversed at the cost of the lives of community members speaks to the continued challenge we face in confronting our pervasive roadway crisis.
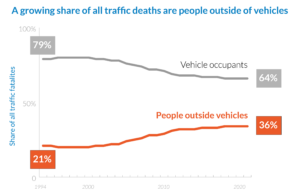
3. Fatalities outside vehicles are a growing share of all traffic fatalities
2022 represents the largest proportion of deaths for those outside of vehicles in 40 years. What is frustrating and disappointing is that we both know our streets are dangerous by design, and we know the steps that need to be taken to prevent death and injury. Want proof? Look at the drop in deaths for people within vehicles that have grown increasingly safer, thanks to new safety mandates and improved vehicle technology.
Those outside of vehicles have not received the same level of attention. Our streets continue to put people walking, biking, and rolling at risk by creating environments that prioritize speed over safety. Unfortunately, calls for change are often met with small incremental changes to funding or, even worse, silence. As Beth Osborne, SGA’s vice president of transportation and thriving communities, recently said in an interview with CBS News, "We spend about $50 billion a year on our roadway system, and we have separated out spending on those safety considerations as a specialized small part of that funding, which shows you that that is not a priority."
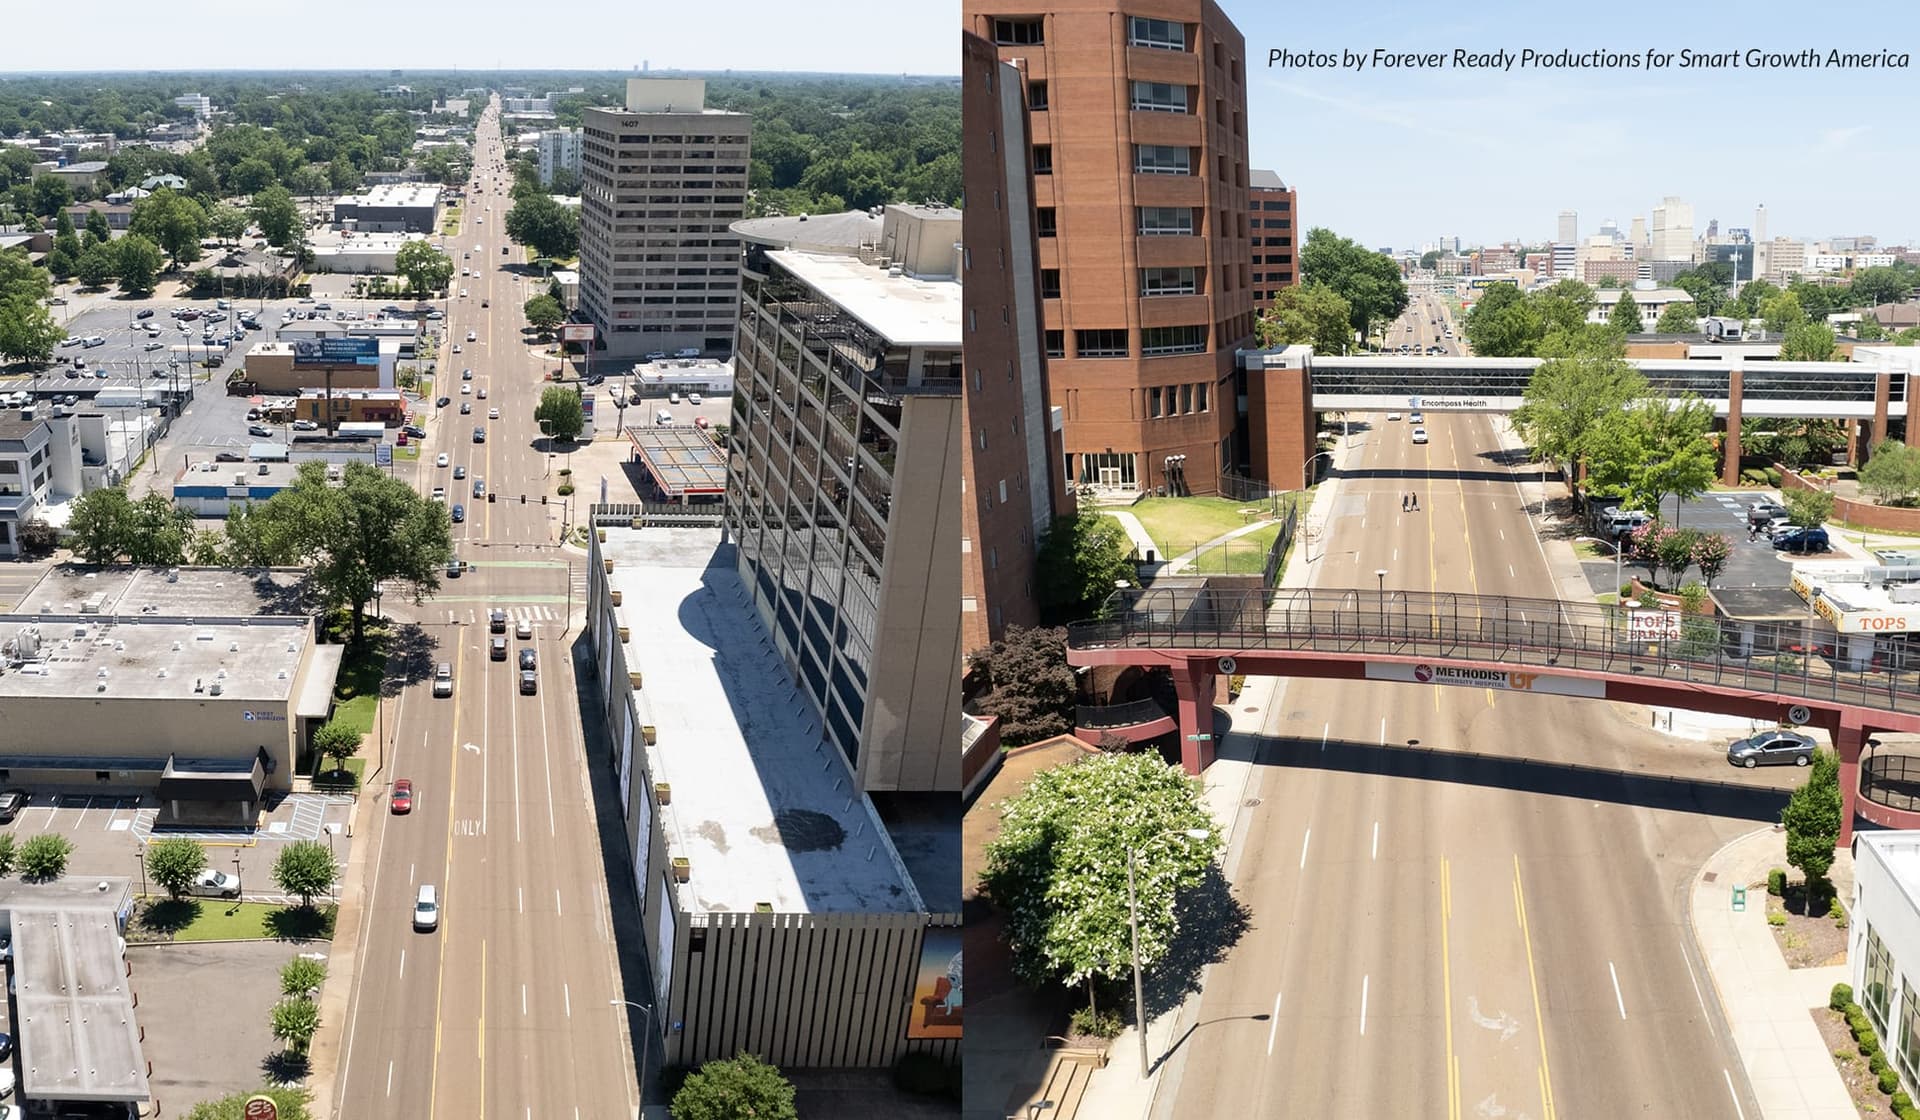
4. Total traffic fatalities are up nearly 10k in urban areas since 2013 (while holding steady in rural communities)
What is the culprit for the disparity in danger? We should look closely at state DOTs. Within these urban areas, nearly two-thirds of all traffic fatalities occur on state-owned arterial roads. Even in places with the right recipe of passionate advocates, champions in government, and a commitment to design best practices, local efforts more often than not run into challenges when they attempt to make safety improvements to state-owned facilities. A downtown core of any size is no place for a state-owned highway that prioritizes moving vehicles as fast as possible. One way to make state-owned arterials safer with the input of local communities? Collaborating on quick-build demonstrations. Take a look at our most recent report to see how we worked with Alaska, California, Connecticut, and Tennessee to use temporary materials to make streets safer for folks in and out of cars alike.
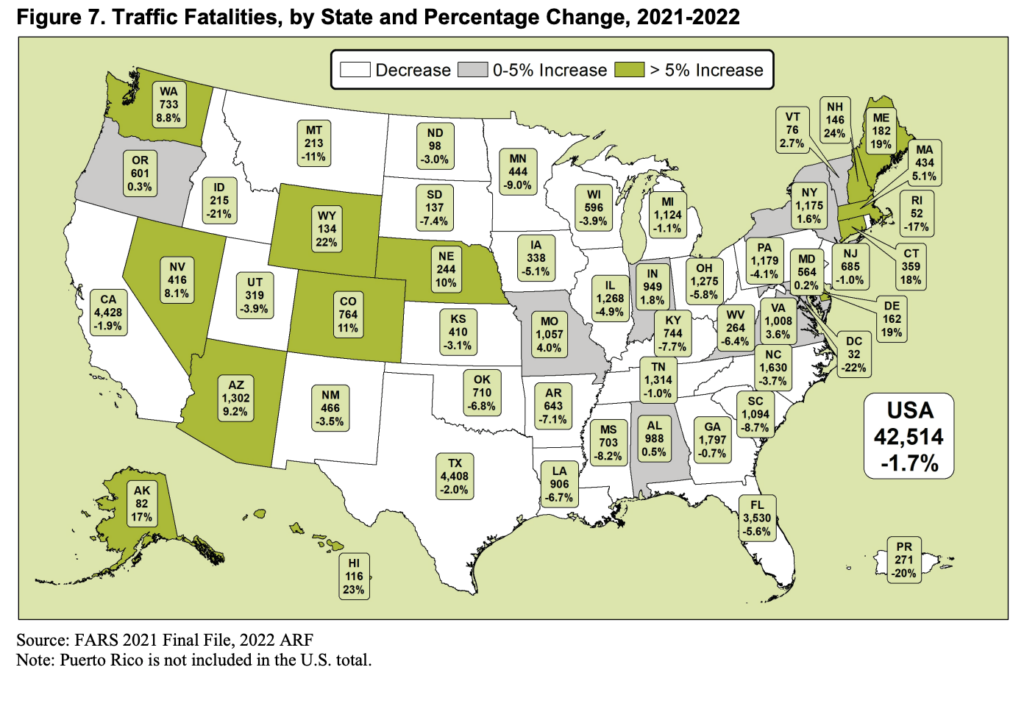
5. The disparate outcomes by state demonstrate the need for more leadership from USDOT
Some states have made major strides in reducing total traffic fatalities. According to the new data, states across the sunbelt—many of which consistently top our ranking of deadliest states for pedestrians in our Dangerous by Design reports—reduced traffic fatalities overall between 2021 and 2022 (stay tuned for more from us on how their progress breaks down across modes). While these states should celebrate their progress, too many others did not see a similar reduction. Even in a year when overall fatalities went down, ten states saw fatalities increase by more than five percent. We need leadership at the federal level that leads to action—action that uses proven best practices and interventions to improve safety and hold accountable those who are in positions to create change but stand in the way of progress. Here are a few recommendations we shared in our last Dangerous by Design report:
- USDOT should adopt the position that safety and speed are incompatible goals in cities, towns, villages, and anywhere with many conflict points and vulnerable users, and they must stop allowing transportation agencies at the state and local levels to claim safety benefits from congestion reduction projects
- USDOT should steer more funding toward improving safety and provide transparent reporting on state spending
- Congress should fully fund all programs intended for combating the rising rates of pedestrian fatalities
- Congress should enable stronger federal action by directing USDOT and FHWA to release stronger rules and guidance on protecting vulnerable road users.
Read the full recommendations here
Groundhog Day: Why does this data take so long to produce?
While I could write something new, my colleague Steve Davis said it best in a blog post from when the 2021 crash data was released last April:
“Up until a few years ago, it took about 9-10 months to provide the full highway safety data set in searchable form, meaning it would be available by October of the following year. Over these months, the data was collected, reviewed, corrected, and put into a searchable database for the public to access. That lag has grown to about 15 months over the past few years…it is hard for safety and transportation agencies at almost any level to tackle the root causes of this epidemic when our picture of the crisis is always 15 months out of date.”
Covid often gets blamed for this slowdown, but even the 2019 data was released in mid-December 2020, 3.5 months faster than this data. If NHTSA can’t get this data together earlier, they need to clearly explain what the obstacles are and press USDOT and Congress to step in and mandate whatever changes are required to do better.
What can be done?
We know the problem, we know the cause, and we know how to fix it. Our streets are dangerous by design, designed primarily to move cars quickly at the expense of keeping everyone safe. Transportation officials have the tools—from safer speed limits to safer street designs—that are proven to save lives and can quickly stem America’s traffic safety crisis. Read this guest post from the National Association of City Transportation Officials from our last Dangerous by Design report for a few examples to make dangerous streets safer. But until there is the political will to say that pedestrian fatalities are unacceptable and to actually implement these changes, the crisis will continue to grow worse.
Related News


Livable places. Healthy people. Shared prosperity.


© 2026 Smart Growth America. All rights reserved
Site By3Lane Marketing
