


News
By Michael Rodriguez, October 25, 2019
Here in Smart Growth America’s home of Washington, DC, the city is abuzz with World Series fever as game three gets underway tonight at Nationals Park near the Navy Yard area of the District of Columbia. This got us thinking: which Major League ballparks are in neighborhoods with development patterns most consistent with smart growth principles?

To get some rough sense of this we ran some numbers based on walkability, transit, and population density around each of the ballparks.
First some caveats: stadiums aren’t in and of themselves smart growth, and much of the evidence suggests that stadiums don’t truly cause economic development. We would certainly argue that public funds should go towards promoting infrastructure, public transit, housing and social equity programs before subsidizing private stadium development.
But nonetheless, if there is a stadium—or if the decision is made to build one—the surrounding development be as consistent with quality, inclusive smart growth development patterns as possible. To the extent that fans are drawn and that the local establishments become employment centers, cities are better off having mixed-use development, quality transit, and context-sensitive density and housing nearby. It’s in this spirit that we measured the 30 Major League ballparks on dimensions of walkability, transit, and population density.
While much of our office is certainly hoping the Nationals bring the first baseball championship to the District since the Homestead Grays won the Negro League championship in 1948 (or 1924 when the MLB Senators won the World Series), who will win the Smart Growth America ballpark championship?
Smart growth ballparks include walkability, transit and population
Smart growth principles include having walkable (W) amenities close by, high quality transit (T), and a mix of land uses that involve residential development and population (P) (see our methodology at the bottom for how we measured and calculated these). By our Smart Growth America Ballpark index (SG), the National League champions are the Chicago Cubs at Wrigley Field, and the American League champions are the New York Yankees at new Yankee Stadium in the Bronx. Without further ado, here are your 2019 Smart Growth America Ballpark Championship standings!
2019 Smart Growth America Ballpark Championship
| National League | ||||
| Walkable amenities |
High-quality transit |
Proximity to population |
Total score | |
| East | W | T | P | SG |
| Washington | 58 | 43 | 48 | 51.4 |
| Miami | 56 | 40 | 56 | 49.9 |
| Philadelphia | 42 | 48 | 49 | 45.1 |
| New York | 34 | 55 | 48 | 43.8 |
| Atlanta | 40 | 31 | 43 | 37.1 |
| Central | W | T | P | SG |
| Chicago | 60 | 55 | 64 | 58.7 |
| Pittsburgh | 54 | 56 | 44 | 53.7 |
| Cincinnati | 53 | 51 | 46 | 51.4 |
| St. Louis | 52 | 47 | 44 | 49.4 |
| Milwaukee | 29 | 34 | 44 | 32.8 |
| West | W | T | P | SG |
| San Francisco | 58 | 60 | 52 | 58.3 |
| Colorado | 59 | 55 | 51 | 56.6 |
| San Diego | 60 | 51 | 52 | 55.8 |
| Arizona | 48 | 46 | 43 | 46.6 |
| Los Angeles | 33 | 45 | 46 | 38.9 |
| American League | ||||
| Walkable amenities |
High-quality transit |
Proximity to population |
Total score | |
| East | W | T | P | SG |
| New York | 60 | 67 | 94 | 66.3 |
| Toronto | 62 | 66 | 62 | 63.5 |
| Boston | 61 | 61 | 62 | 61.2 |
| Baltimore | 58 | 59 | 50 | 57.5 |
| Tampa | 45 | 35 | 46 | 41.1 |
| Central | W | T | P | SG |
| Minnesota | 57 | 60 | 49 | 57.5 |
| Cleveland | 57 | 54 | 45 | 54.7 |
| Detroit | 57 | 50 | 45 | 53.0 |
| Chicago | 49 | 51 | 51 | 50.0 |
| Kansas City | 32 | 31 | 42 | 32.4 |
| West | W | T | P | SG |
| Seattle | 52 | 56 | 45 | 52.8 |
| Houston | 49 | 58 | 48 | 52.2 |
| Oakland | 49 | 48 | 45 | 48.0 |
| Los Angeles | 39 | 38 | 43 | 39.1 |
| Texas | 36 | 32 | 43 | 35.1 |
W- Walkability Index
T- Transit Index
P- Population Index
SG- Smart Growth Index (Weighted Total)
With the full rankings out of the way, here are profiles of each of the six division champions in the rankings, which include include a range of stadiums, both old and new, and different types of development and smart growth principles.
NL East: Nationals Park, Washington, DC
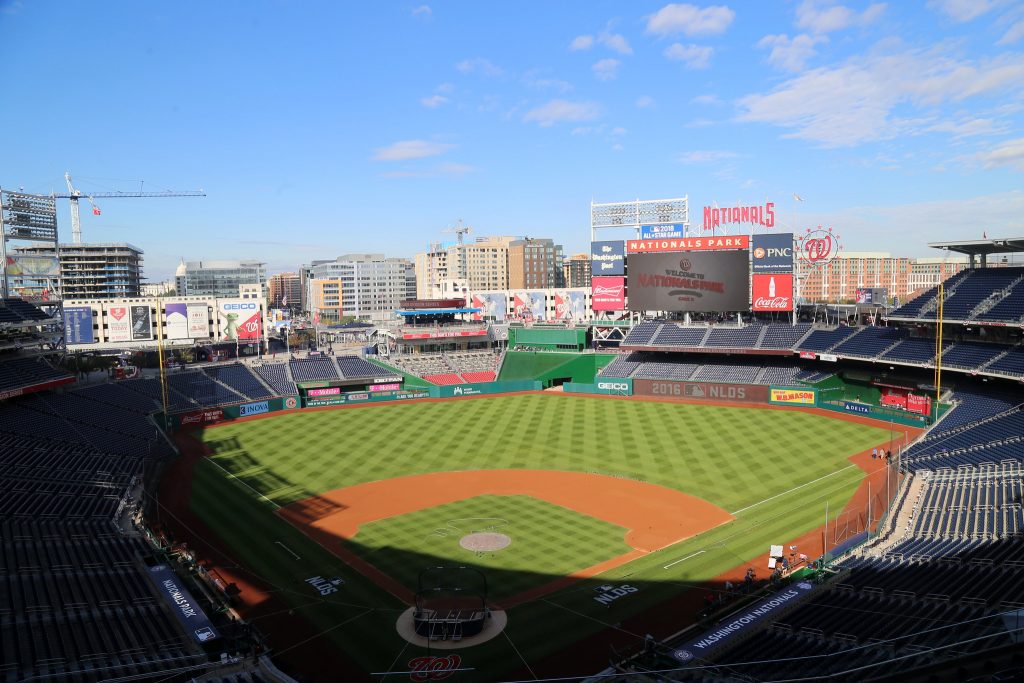
Photo credit: Arturo Pardavila (CC BY)
Year opened: 2008
Neighborhood: Navy Yard
WalkScore (0-100): 89
TransitScore (0-100): 62
Transit connectivity Index (0-100): 31
Population in 25-minute walk: 30,177
Major transit: WMATA (Green)
The 2019 National League champions play in the ballpark with the highest score in their division. It sits prominently on the Anacostia River in Washington, DC’s Navy Yard neighborhood which is booming with new residential, office and retail development. The neighborhood is accessible to two stops on the WMATA Metro rail’s green line, and can be reached by numerous bus lines as well as the DC Circulator bus. Its dense, mixed-use environment is also within a one-mile walk to other newly developed destinations like The Wharf and The Yards, as well as older, historic neighborhoods in the Southwest quadrant of the city (though many of these neighborhoods were wiped out by urban renewal and the development of the Southeast/Southwest freeway in the 1960’s.) Major bike facilities can be found near the ballpark, which also has a free bike valet which has been filled to capacity during the playoffs this year. Currently the Navy Yard is one of the fastest growing areas of DC, and the 2019 World Series is certainly bringing plenty of attention to this neighborhood.
Bonus: the first home for baseball in Washington, DC was Griffith Park in the African-American neighborhoods of Ledroit Park and U Street, which is still a dense, mixed-use neighborhood with leafy, walkable streets, rowhouses, and good transit access that has a feel much like the neighborhood around Wrigley Field in Chicago. If this park was still was standing today, it would also score well. Unfortunately, it was demolished in 1965 just a few years after the Senators left Washington to move to Texas.
NL Central (NL Champions): Wrigley Field, Chicago, IL
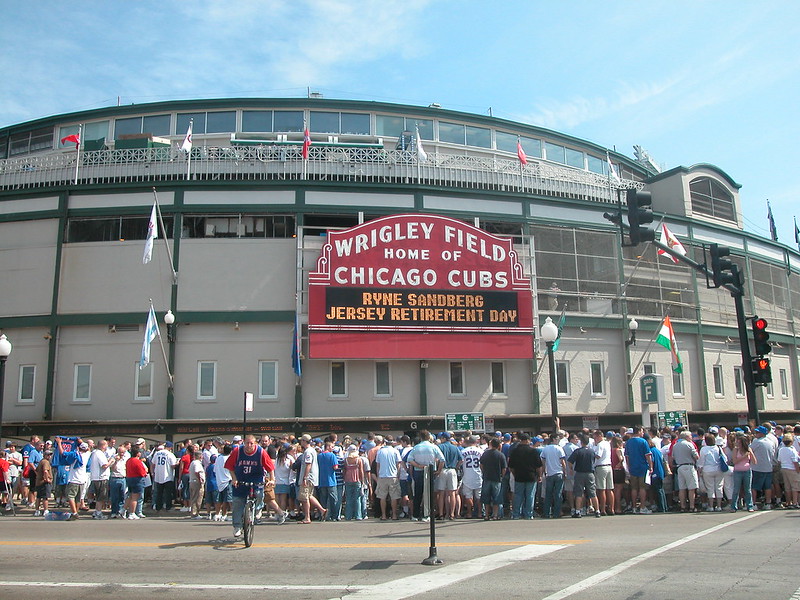
Photo credit: David Wilson (CC BY)
Year opened: 1914
Neighborhood: Wrigleyville
WalkScore (0-100): 94
TransitScore (0-100):87
TCI (0-100): 85
Population in 25-minute walk: 105,696
Major transit: CTA (Brown/Red)
The second-oldest stadium in the league after Fenway Park in Boston, the iconic Wrigley Field so defines its community that the neighborhood of Wrigleyville is named after this home of the Chicago Cubs. The ivy-clad stadium was declared a National Historic Landmark in 1987 and its eclectic walkable neighborhood boasts a mix of townhomes, apartment buildings, restaurants and bars. A convenient ride on the El (Red or Brown line) gets you to the ballgame but the experience of walking through the dense, leafy, beautiful neighborhood and then being surprised by the sudden appearance of this small, historic park is not to be missed.
NL West: Oracle Park, San Francisco, CA
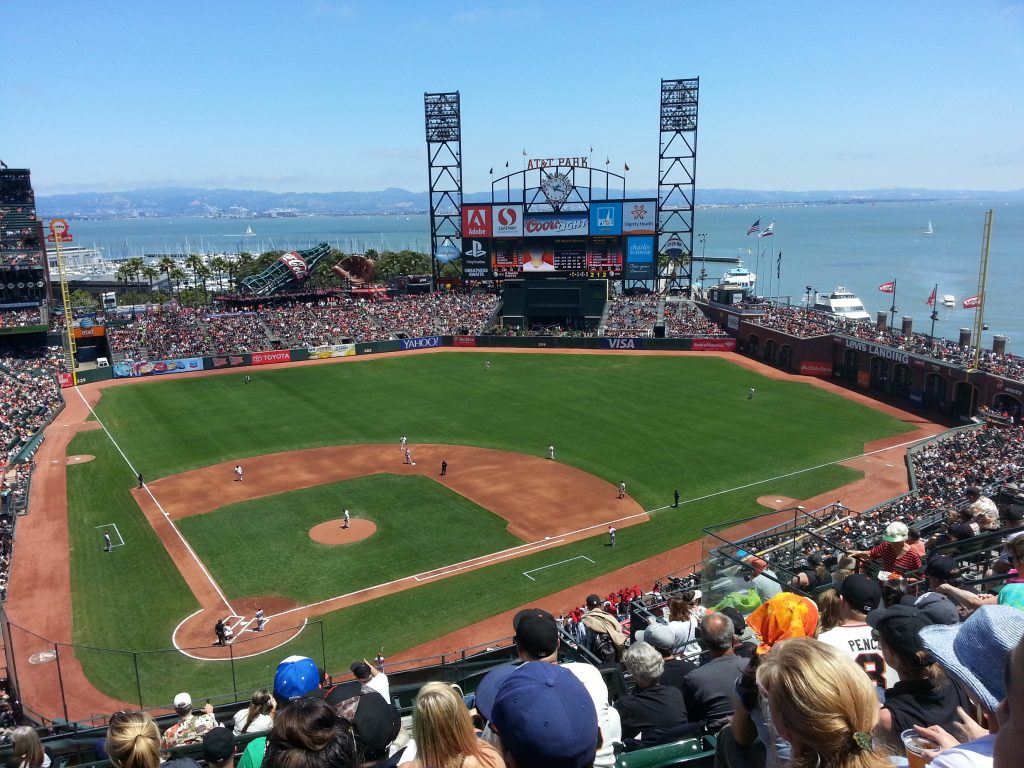
Photo credit: Alex Hendricks (CC BY)
Year opened: 2000
Neighborhood: South Beach
WalkScore: 88
TransitScore: 90
TCI: 41
Population in 25-minute walk: 48,035
Major transit: Caltrain and Muni light rail (K/KT/N)
Part of a late 1990s/early-2000s trend to revitalize waterfronts, Oracle Park (originally Pacific Bell Park / AT&T Park) is a major draw for Giants fans in the South Beach neighborhood right on the water. The neighborhood has a quintessentially Bay Area urban feel with tons of amenities nearby. Bay Area residents can get there on Caltrain, and while BART is a bit over a mile walk, there’s a Muni light-rail station right on site. The ballpark sits on an incredibly constrained site that led to some of its most unique features, like the ability for long homers to right field to land in McCovey Cove where they are often scooped up by kayakers waiting for a souvenir.
AL East (AL Champions; Smart Growth America ballpark champions): Yankee Stadium, Bronx, NY
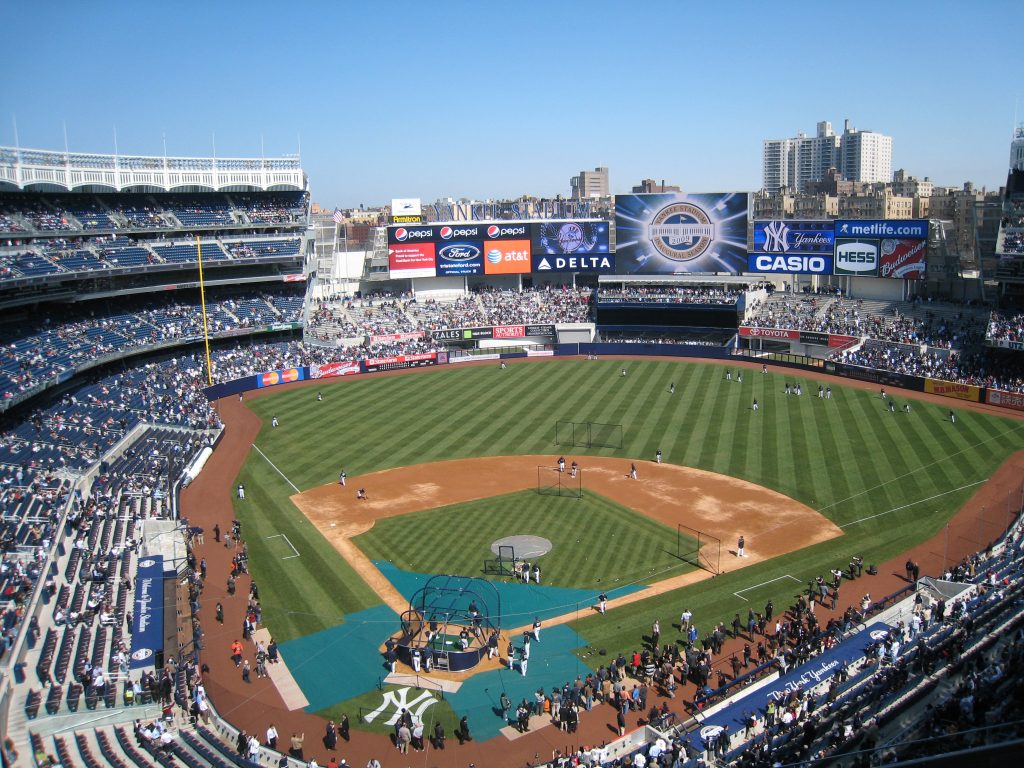
Photo credit: Lawrence Fung (CC BY)
Year opened: 2009
Neighborhood: Concourse/Highbridge, Bronx
WalkScore: 94
TransitScore: (not ranked)
TCI: 46
Population in 25-minute walk: 248,416
Major transit: MTA Subway (B/D/4) MTA Metro North (Harlem/Hudson/New Haven)
The House that Ruth Built next door was decommissioned in 2009 when the new Yankee Stadium hosted its inaugural Yankees game. Straddling the Bronx Concourse and Highbridge neighborhoods it is the most densely urban stadium: there are over 248,000 people who live within a 25-minute walk of Yankee Stadium (far more than the rival New York Mets in Flushing). While there is not a stadium village like Fenway Park in Boston or Wrigleyville, there are retail nodes along 161st Street and a close grid of streets. Yankee Stadium is accessible by MTA Subway (B/D/4) and MTA Metro North (Harlem/Hudson/New Haven) for those who live further away in the region.
AL Central: Target Field, Minneapolis, MN
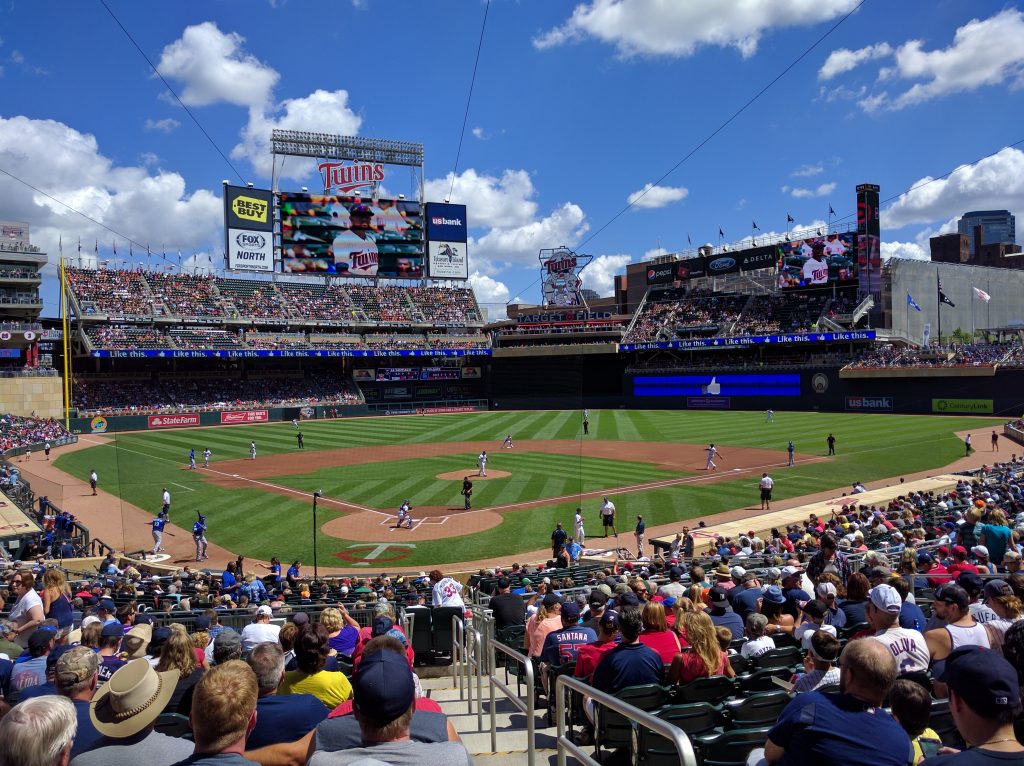
Photo credit: Wikimedia Commons (Runner1928) (CC BY)
Year opened: 2010
Neighborhood: North Loop
WalkScore: 85
TransitScore: 92
TCI: 40
Population in 25-minute walk: 33,644
Major transit: METRO light rail (Blue/Green); Northstar Line
Target Field is an example of a more recent downtown revitalization effort in Minneapolis, being closely integrated with a new transit hub and with future transit-oriented development in mind. In this sense it was consciously built with several smart growth principles in mind, and ridership has far exceeded expectations. The stadium is an example of a brownfield redevelopment success, receiving the 2010 Brownfield Renewal Award for Economic Impact by replacing a parking lot covering 20 feet of urban fill. Both the METRO blue and green light rail lines alight right at the ballpark, and commuters can arrive via the Northstar line as well.
AL West: T-Mobile Park, Seattle, WA
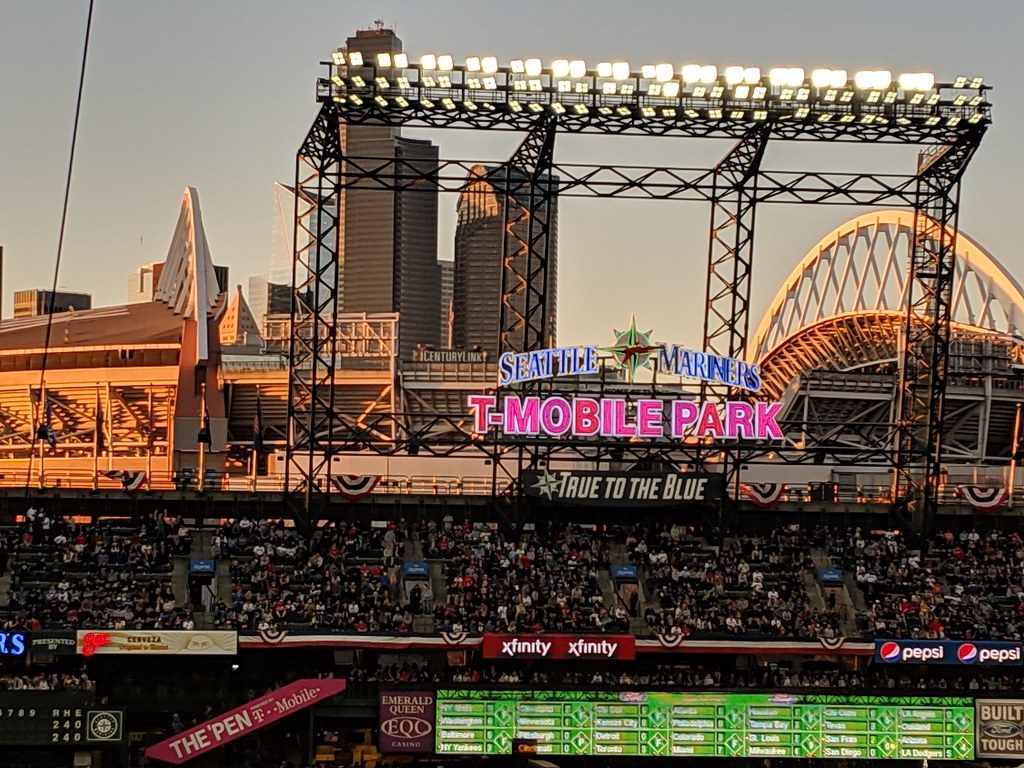
Photo credit: Susan Dennis (CC)
Year opened: 1999
Neighborhood: Pioneer Square
WalkScore: 71
TransitScore: 100
TCI: 24
Population in 25-minute walk: 16,593
Major transit: Link (Red), Streetcar, Sounder (North/South), Washington State Ferry
Sitting just south of Seattle’s trendy Pioneer Square neighborhood, T-Mobile Park (formerly Safeco Field) is at first glance part of a larger sports complex. It sits just south of CenturyLink Field which is home to Major League Soccer’s Sounders and the NFL’s Seahawks, and near the WaMu Theater. T-Mobile Park wins the AL West because of its quality transit access, which was among the highest in the majors (tied with the Toronto Blue Jay’s Rogers Centre). Options include the Link light rail, streetcar, the Sounder commuter rail (Seattle’s main passenger rail hub is also within walking distance), most bus lines, and even a ferry. It is somewhat disconnected from nearby neighborhoods by rail yards and highways, but there are still over 16,500 people who live within a 25-minute walk.
The not-smart awards
With the winners out of the way, let’s take a quick look at some of the worst performers when it comes to smart growth principles and ballpark site location.
Bottom rank runner-up: Miller Park, Milwaukee, WI
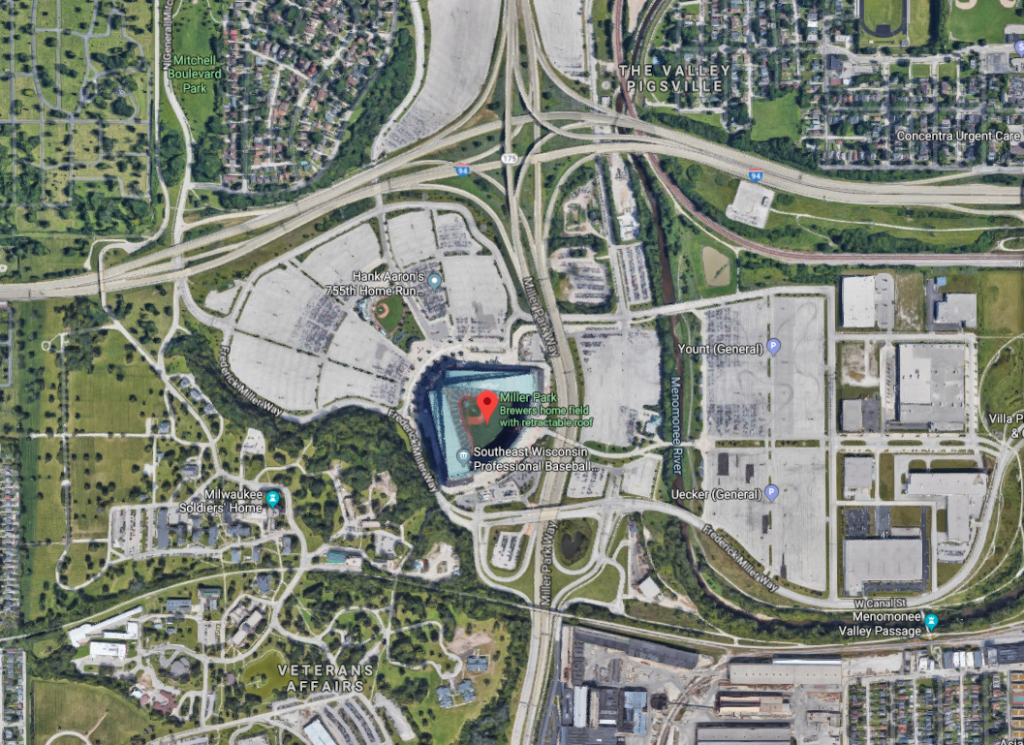
Photo credit: Google Maps
Year opened: 2001
Neighborhood: Story Hill
WalkScore: 13
TransitScore: 39
TCI: 7
Population in 25-minute walk: 12,836
Major transit: none
Miller Park may excite fans with the unique site of Bernie Brewer going down a slide above center field when the Brewers hit a home run, but from a smart growth perspective there’s much less to root for. It is surrounded by a sea of parking. It sits on the far edge of town. There are no major transit connections aside from standard buses, and the complex is disconnected from its community, which itself is neither dense nor mixed use.
Bottom rank: Kauffman Stadium, Kansas City, MO
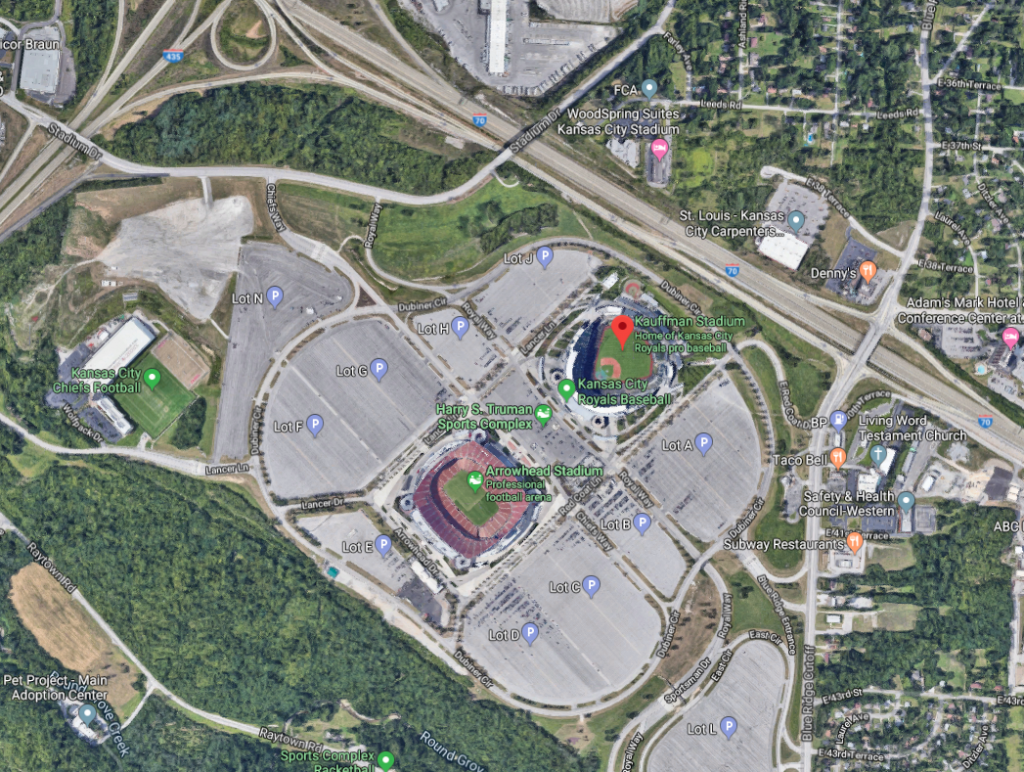
Photo credit: Google Maps
Year opened: 1973
Neighborhood: near Cunningham Ridge
WalkScore: 20
TransitScore: 32
TCI: 2
Population in 25-minute walk: 322
Major transit: none
Kauffman Stadium in Kansas City, MO ranks at the bottom of our Smart Growth Ballpark index. After all, there are only 300-some residents within a 25-minute walk from the stadium, and even those might just be a GIS artifact. It sits in a massive sea of parking, has the worst transit connectivity index in MLB, and there’s almost nothing to walk to, except perhaps a hike to the NFL Kansas City Chiefs’ Arrowhead Stadium which shares the site, or back to your car somewhere in parking section H31. Municipal Stadium, which was the home for the Royals’ first four seasons in KC and located just southeast of downtown in a walkable neighborhood, was demolished in 1976.
Methodology
Walkability index: WalkScore. An index (0 to 100) of walkability and access to various amenities. Source: WalkScore
Transit index: The average of TransitScore (0 to 100) and Center for Neighborhood Technology’s (CNT) Transit Connectivity Index (TCI) (0 to 100) when available. Some cities had one score and not the other. Both of these measures, and especially CNT’s TCI, reward not only whether there is transit, but also the quality of the transit and the frequency. Source: WalkScore; Center for Neighborhood Technology
Population index: The number of people living within a 25-minute walk from the stadium. This is to account for approximately 10-minute walk from the center of the stadium itself and the grounds of the ballpark. It is meant to approximate a 15-minute walk. Source: ESRI Business Analyst; US Census; Statistics Canada
Smart Growth America Ballpark Index: A weighted average of the walkability, transit, and population index. Walkability=50% Transit =40% Population=10% The reason population is weighted lower is because population density is somewhat implicit in walkability; and residential density is only part of smart growth. We should note that this index is no way is a definitive definition of smart growth—we’re just having some fun with baseball here.
All scores for walkability, transit, and population were converted to Z-scores of a population of all 30 Major League ballparks. Z-scores were converted to “psychometric T-scores” (to convert to a 100-point scale) based on index = z-score x 10 + 50.
Related News


Livable places. Healthy people. Shared prosperity.


© 2025 Smart Growth America. All rights reserved
Site By3Lane Marketing
