


News
By Natasha Riveron, October 5, 2018
This September, we hosted “Innovation in Complete Streets Infrastructure” the tenth installment in our monthly webinar series Implementation & Equity 201: The Path Forward to Complete Streets. Due to a technical glitch, only a partial recording of the webinar is available. However, you can also download a PDF of the presentation or read the in-depth recap below.
A discussion recap
Emiko Atherton, Director of the National Complete Streets Coalition, kicked off the webinar with a sobering statistic: in 2016, almost 6,000 pedestrians were struck and killed on America’s streets. We know that we can prevent these deaths through better road design that prioritizes people over cars. The National Complete Streets Coalition will dig into the newest data this year in our flagship report, Dangerous by Design 2018, which ranks the most dangerous places to walk in the U.S.
As Emiko noted, over 1,300 communities across the U.S. have adopted Complete Streets policies to date. But to make a real impact, these policies must be translated into implementation. So, the National Complete Streets Coalition invited local leaders from Seattle and Pasadena to share how their cities are implementing their policies for safe, efficient, and equitable street design.
Seattle
Dongho Chang, City Traffic Engineer for Seattle, shared the city’s policy framework for growth and described examples of how Complete Streets projects are pushing the boundaries on implementation and equity for one of the fastest growing cities in the nation.
Prioritizing safety and mobility
Seattle passed a Complete Streets ordinance in 2007. Since then, its highest priority has been safety while also maintaining efficient mobility. The city’s goal to move people efficiently motivated it to invest in a wide array of street and mobility projects as well as incremental improvements.
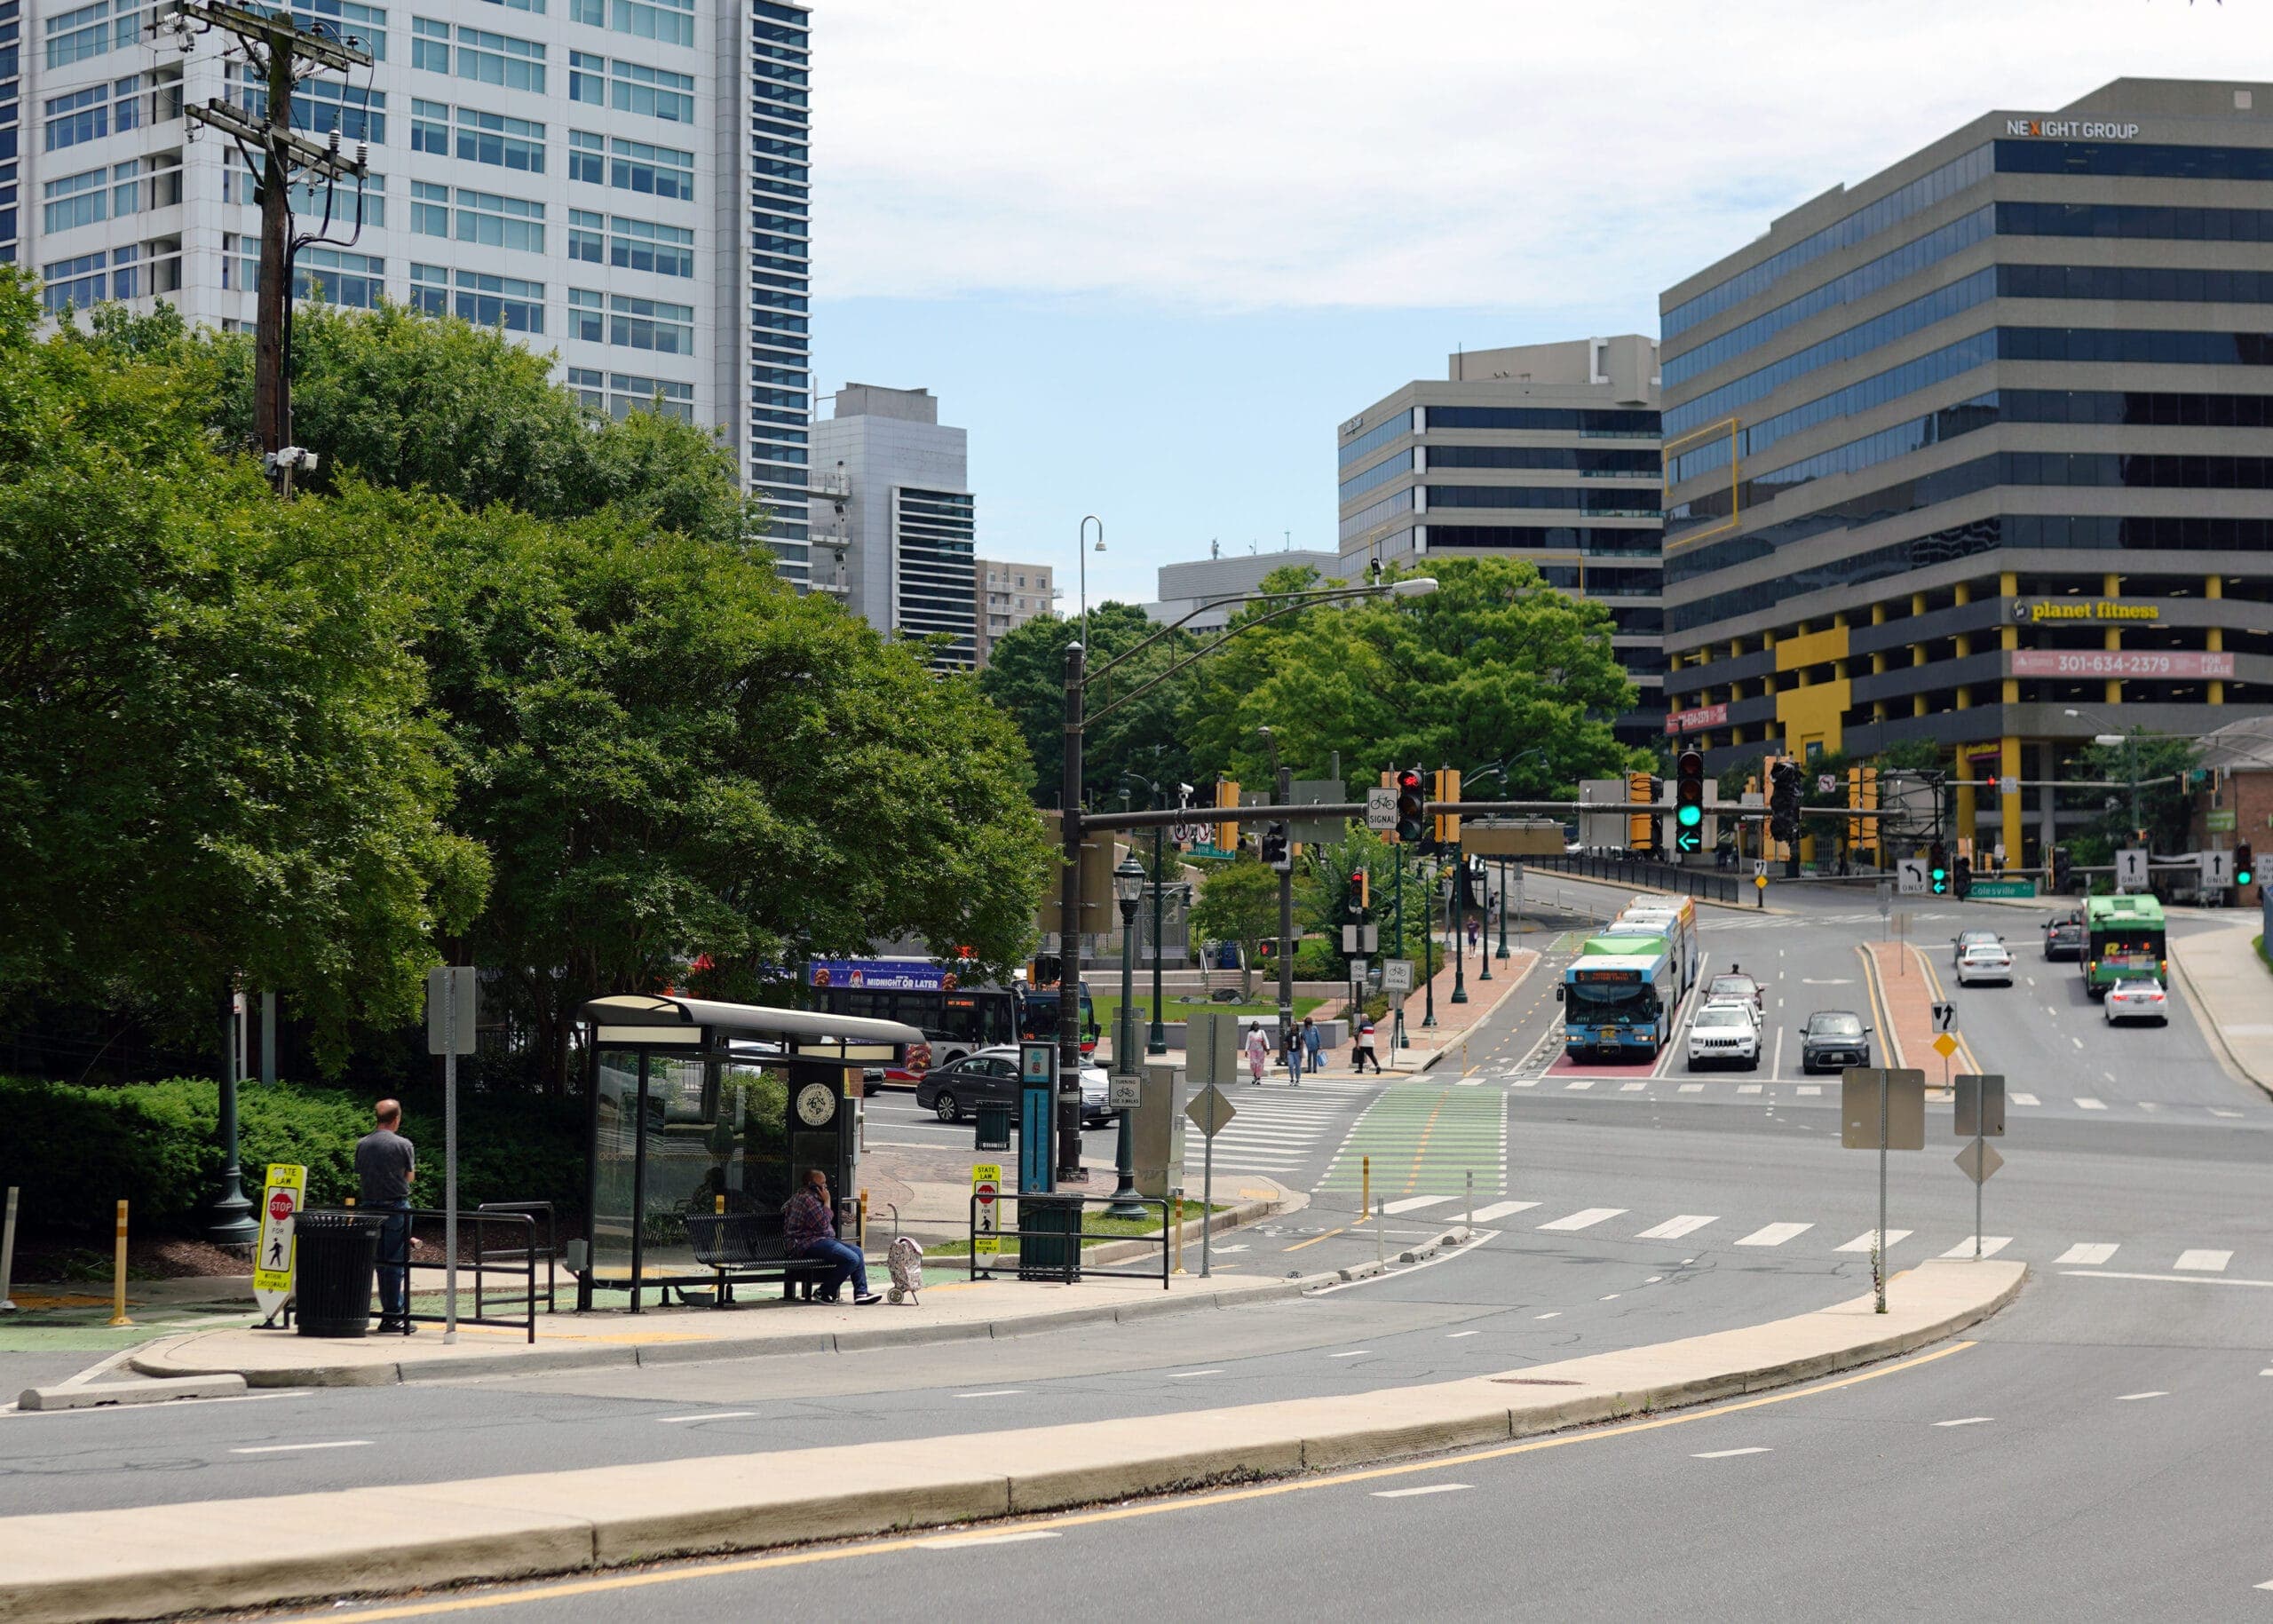
Seattle made bus systems changes that led to a significant increase in ridership, including:
- Extended service hours
- Established bus-only lanes and dedicated bus signals
- Added real-time information signs
- Expanded rider waiting areas with upgrades to shelters and lighting.
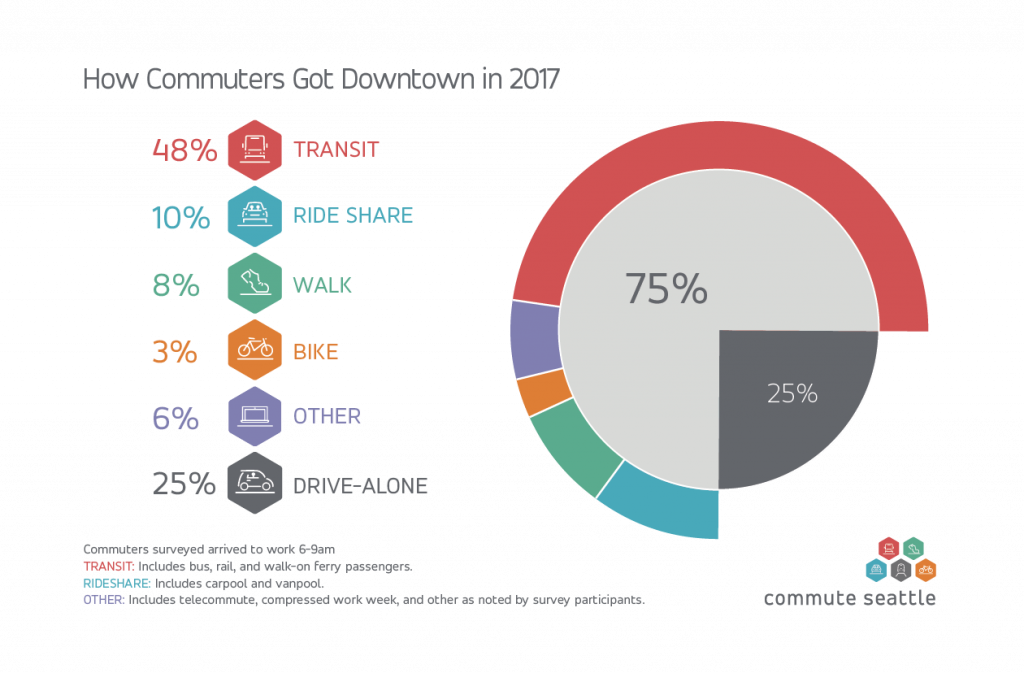
From 2010 to 2017, Seattle also added thousands of jobs in the downtown core while significantly decreasing the number of solo car trips. This meant far higher use of alternative modes of transportation and more efficient movement of people in and out of downtown. Complete Streets were a critical component of creating streets that made people feel comfortable enough to walk, bike, or take transit to their destinations. Once people felt more comfortable, they were far more likely to walk and bike and that showed in the data.
To bolster Complete Streets efforts, Seattle developed a checklist to identify specific street improvements to balance safety and access for all users. This includes, but is not limited to:
- Implementing road diets that reduce the number and width of lanes to provide more dedicated space for other modes of transportation.
- Reducing speed limits, improving or adding traffic signals, and making other changes to reduce collisions.
- Maintaining sidewalks and street trees.
- Allocating curb space more flexibly to support adjacent land use.
- Adopting plans for pedestrian, bicycle, transit, and freight transportation.
- Incorporating art, green stormwater systems, and urban forestry in the city’s streetscapes.
Integrated plans
The city’s commitment to Complete Streets goes beyond the ordinance and impacted the the Seattle 2035 comprehensive plan. As Dongho explained, the plan incorporates strong Complete Streets elements by focusing on safe, reliable, affordable, equitable, and high-quality travel options.
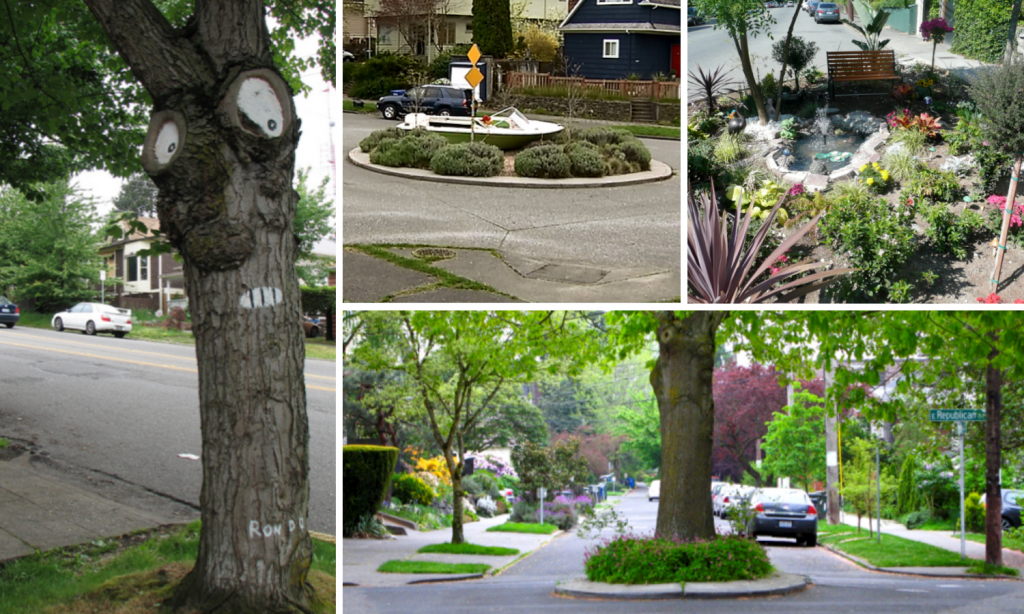
Traffic calming and place making
Traffic circles have been one of Seattle’s most successful traffic calming measures. They’ve reduce collisions by 90 percent, and provide a unique opportunity for place-making. In Seattle there are 1,500 traffic circles, with 1,343 dedicated volunteers to maintain them.
Data-driven decisions
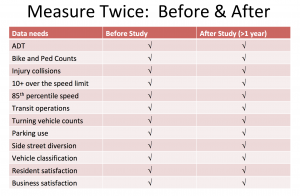 Dongho emphasized the importance of using data to inform transportation decisions. But using data isn’t important upfront; gathering data after projects have been implemented can better inform future Complete Street investments and point to possible changes that need to be made. Seattle has a list of the factors the city measures both before and after interventions.
Community engagement
Finally, Dongho reiterated the importance of engaging the community when implementing Complete Streets, particularly for projects like road diets that may face initial resistance if people do not fully understand the potential benefits. Dongho explained that cities must clearly convey how the project will improve both mobility and safety for more roadway users to generate community support. Then, once the project is on the ground, people will experience these benefits for themselves.
Pasadena
Fred Dock, Director of Transportation in Pasadena, described the city’s innovative effort to implement Complete Streets using smart metrics and improved operations. To begin, Fred noted that Pasadena did not create its approach in a vacuum. It looked to other cities (like Seattle) for inspiration.
Smart metrics
Pasadena approached Complete Streets implementation with the understanding that with limited resources, it needed to build an integrated process to meet Complete Streets, environmental, maintenance, and traffic management goals over time. City staff realized that to drive implementation they needed to decide how to define and measure success.
They started with their current measure for transportation performance: level of service (LOS). LOS is measured in letter grades, where an A means cars and trucks move in a free flow at or even above the speed limit while and F is gridlock. But this measure leaves out a whole swath of people walking, biking, and using transit; and improving LOS can actively make streets more dangerous for people outside of cars. So they switched their measure to vehicle miles traveled (VMT) per capita. The change in how Pasadena assessed it’s streets allowed it to focus more on what it wanted—to reduce trips by car and support other modes.
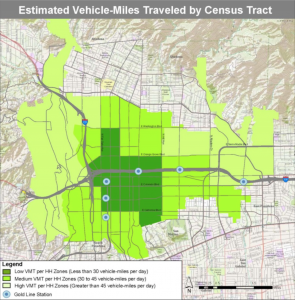 VMT per capita takes total miles traveled by vehicles like cars and trucks and divides it by the city’s total service population, defined as the population plus the number of jobs. Although VMT can increase with the addition of new residents, the city can reduce VMT by encouraging denser development that reduces trip lengths and by increasing access to transportation modes other than the automobile. For more info, check out Description of Transportation Performance Metrics in Pasadena’s Transportation Impact Analysis Current Practice & Guidelines
Aligning plans
Pasadena aligned long-term plans with street-level experience by taking pedestrian, bike, mobility, and transit plans, and incorporating them into an overarching, context-based street design guide. The city focused on what would motivate people to use different modes of transportation in specific locations and found that people often made travel choices based on access to facilities like protected bike lanes. With that information in hand, Pasadena is focusing on creating a network of multi-modal facilities to serve areas where development is happening in order to reduce VMT.
These aligned plans allow multiple city departments to work together toward their similar goals. The city coordinates Complete streets needs with the paving management program in a Complete Streets blueprint. This helps economize, with street repaving funds used to simultaneously advance Complete Streets projects.
These policies have now been in place for about 3 years, and Fred Dock was happy to report that aligning plans and day-to-day implementation has helped reduce greenhouse gasses and VMT per capita, while managing travel demand and calming traffic.
Additional resources
- Pasadena’s Economic Development plan.
- Pasadena’s Street Design guidelines.
- Pasadena’s Transportation Impact Analysis guidelines.
- Seattle’s artistic/community crosswalk program information.
- Seattle’s bicycle/pedestrian safety assessment tool.
- Seattle’s Complete Streets checklist.
- Seattle’s curb space/parking evaluation information that is used for decision making.
- Seattle’s street types and design guides, with the specific example of a downtown street.
Questions?
We had so many great questions during the Q&A section of the webinar that we couldn’t get to all of them. We followed up with Dongho Chang and Fred Dock to discuss answers to some of the questions we missed.
What are specific ways that a public transit agency can influence decision-making regarding Complete Streets?
Fred: One way is by articulating design requirements for transit facilities. Pasadena incorporated on-street stop design and transit priority treatments into the city’s street design guidelines.
Dongho: Transit agencies can also advocate for their customers who depend on bus services for their travel needs. Some examples of steps they can take include:
- Standardize crossing treatment guidelines at bus stops.
- Develop walking/rolling (ADA) access priorities/guidelines (especially for areas of the community that may not be able to advocate for themselves).
- Focus on people moving priorities in policy setting for operations.
- Improve bus user comfort at the stops with joint coordination (better lighting, trees, shelters, lower speeds on the street).
- Prioritize public services such as schools, libraries, medical facilities, and senior housing.
What advice would you give for a city that has Complete Streets guidelines in their comprehensive plan, but has not taken steps toward implementation?
Dongho: I recommend having Complete Streets adopted as an ordinance, which makes it law for the city.
How do you handle community engagement when you implement new projects? Do you engage in a long consultation with the community before acting, or do you do quick tactical urbanism where you do a project and see how people react?
Dongho: We engage community during scoping, early design, and all the way to construction and operational changes after it is built.
In Pasadena, if gridlock did not occur, did the result convince the naysayers to change their metrics? Was their prediction based on faulty or old assumptions?
Fred: The gridlock predictions seemed to be the product of the type of traffic impact analysis used that over predicted the peak period traffic at intersections. Network trend analysis showed that traffic was dispersing over time for routes. We couldn’t tell to what extent one or the other, but the result was that traffic volumes in some corridors were staying relatively stable rather than growing at the rate the traffic impact analyses predicted. We have not convinced our skeptics as there are segments of the public that think there is too much traffic/congestion already, so maintaining conditions at/near existing is not consistent with the outcome those groups are seeking.
Is it possible to combine bus routes with bike lanes, where both share the space?
Dongho: Yes, we have many streets that incorporate transit and bicycle mode, such as 2nd Avenue, Dexter Avenue, and Broadway Avenue…transit and bike tend to work well together when there is space.
I noticed the streets shown in Dongho’s presentation are wide. Do you have any suggestions for narrower streets?
Dongho: 90 percent of fatal and serious injury collisions in Seattle occur on arterial streets, which is 40 percent of our street network. This points to Seattle’s focus on arterial streets and why we are engineering changes on them for safety.
All streets (even narrow streets) can benefit from traffic calming, shorter crossing for pedestrians, and street trees/lighting. Agencies can try removing lane striping on some streets to remove the visual guidance for drivers when it is appropriate. Raised crosswalks, chicanes, speed cushions/humps, and community building artistic treatments can also be tools for narrow streets.
What is the difference between a speed hump and a speed cushion?
Dongho: A speed cushion is designed to allow buses and fire trucks to straddle the bump.
How do you account for the out of City workers in Pasadena? What is the percentage of out of city workers?
Fred: The forecast model includes trips by workers into Pasadena workplaces as well as trips that pass through the city without either origin or destination in Pasadena. Pasadena has about 75 percent out of city workers—see page 7 of the city’s economic development plan for a snapshot of worker/resident demographics.
Who maintains the plants in the traffic circles in Seattle?
Dongho: Both neighborhood volunteers and city crews.
Related News


Livable places. Healthy people. Shared prosperity.


© 2025 Smart Growth America. All rights reserved
Site By3Lane Marketing
