


News
By Smart Growth America, July 12, 2022
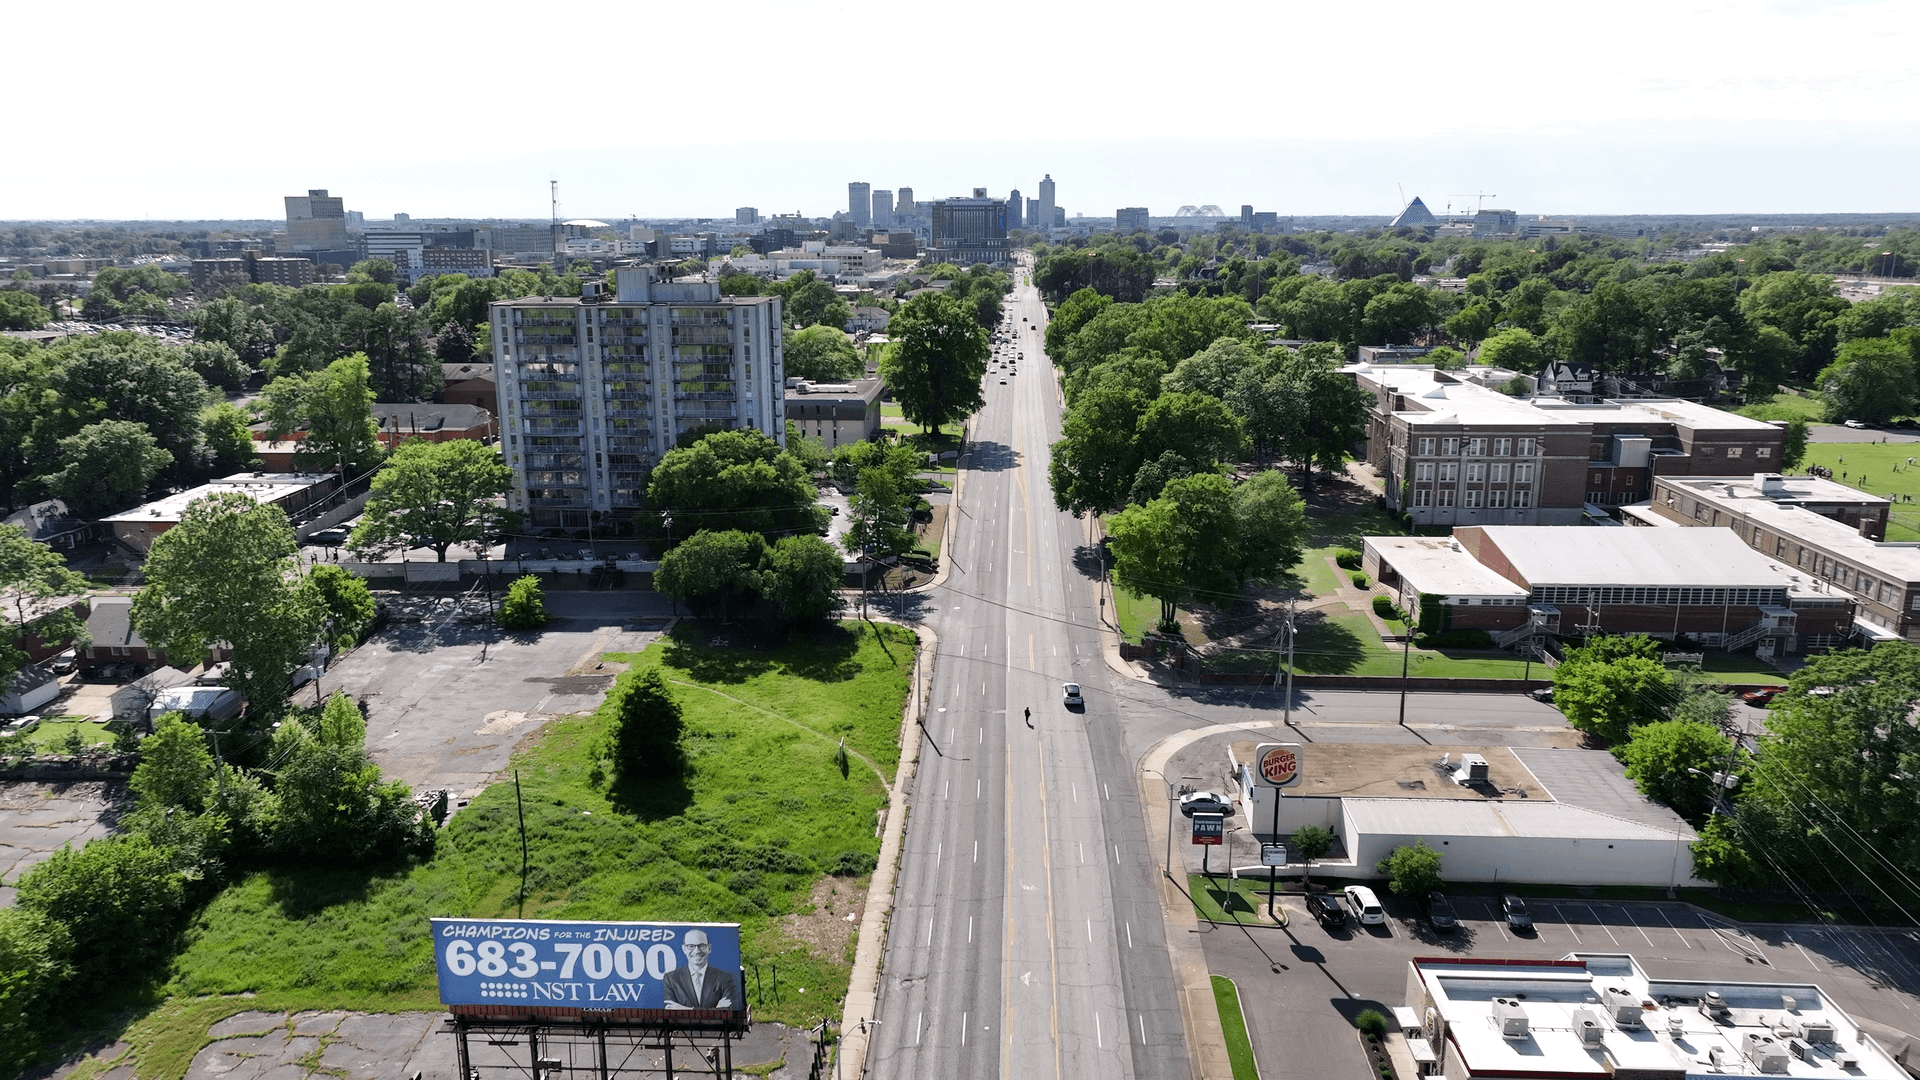
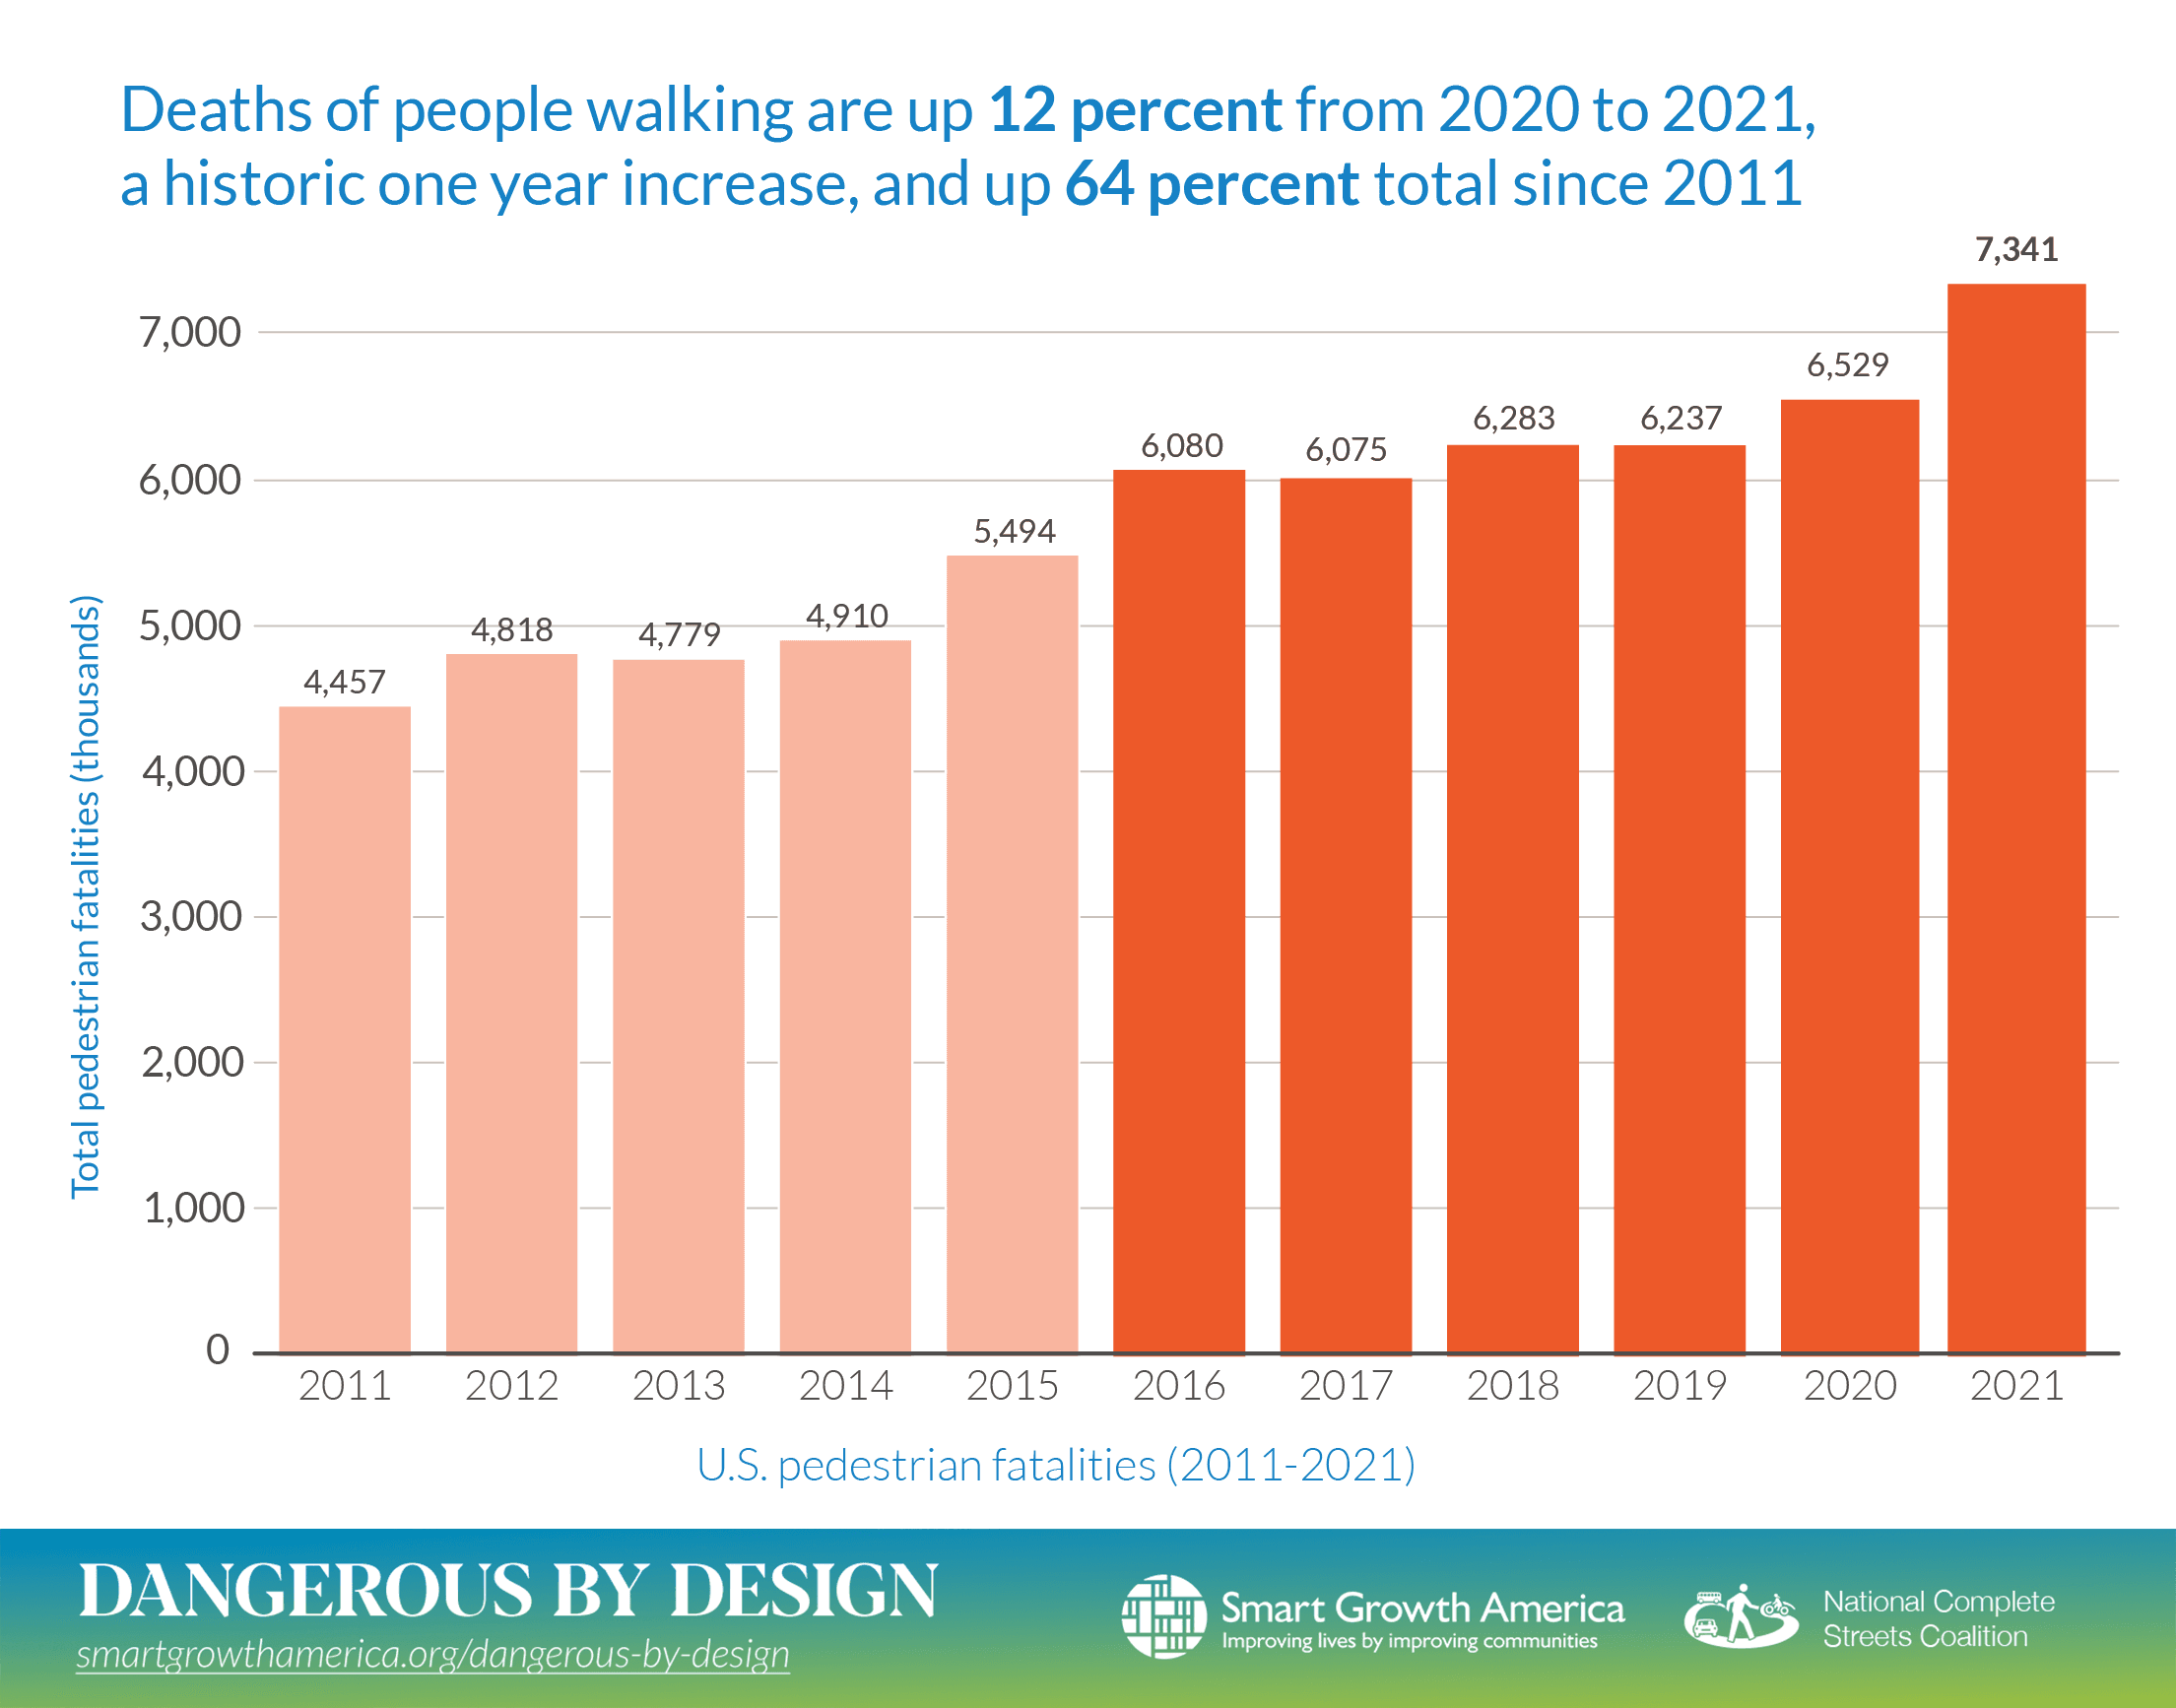
More than 6,500 people were struck and killed while walking in 2020, an average of nearly 18 per day, and a 4.5 percent increase over 2019. News reports tend to blame individual behavior for these crashes, but we have another explanation for the ongoing epidemic of traffic fatalities: our streets are dangerous by design.
 Join the public briefing of Dangerous by Design, our landmark report on the alarming increase in people being struck and killed while walking on July 28th at 3 p.m. ET with the report authors and special guests.
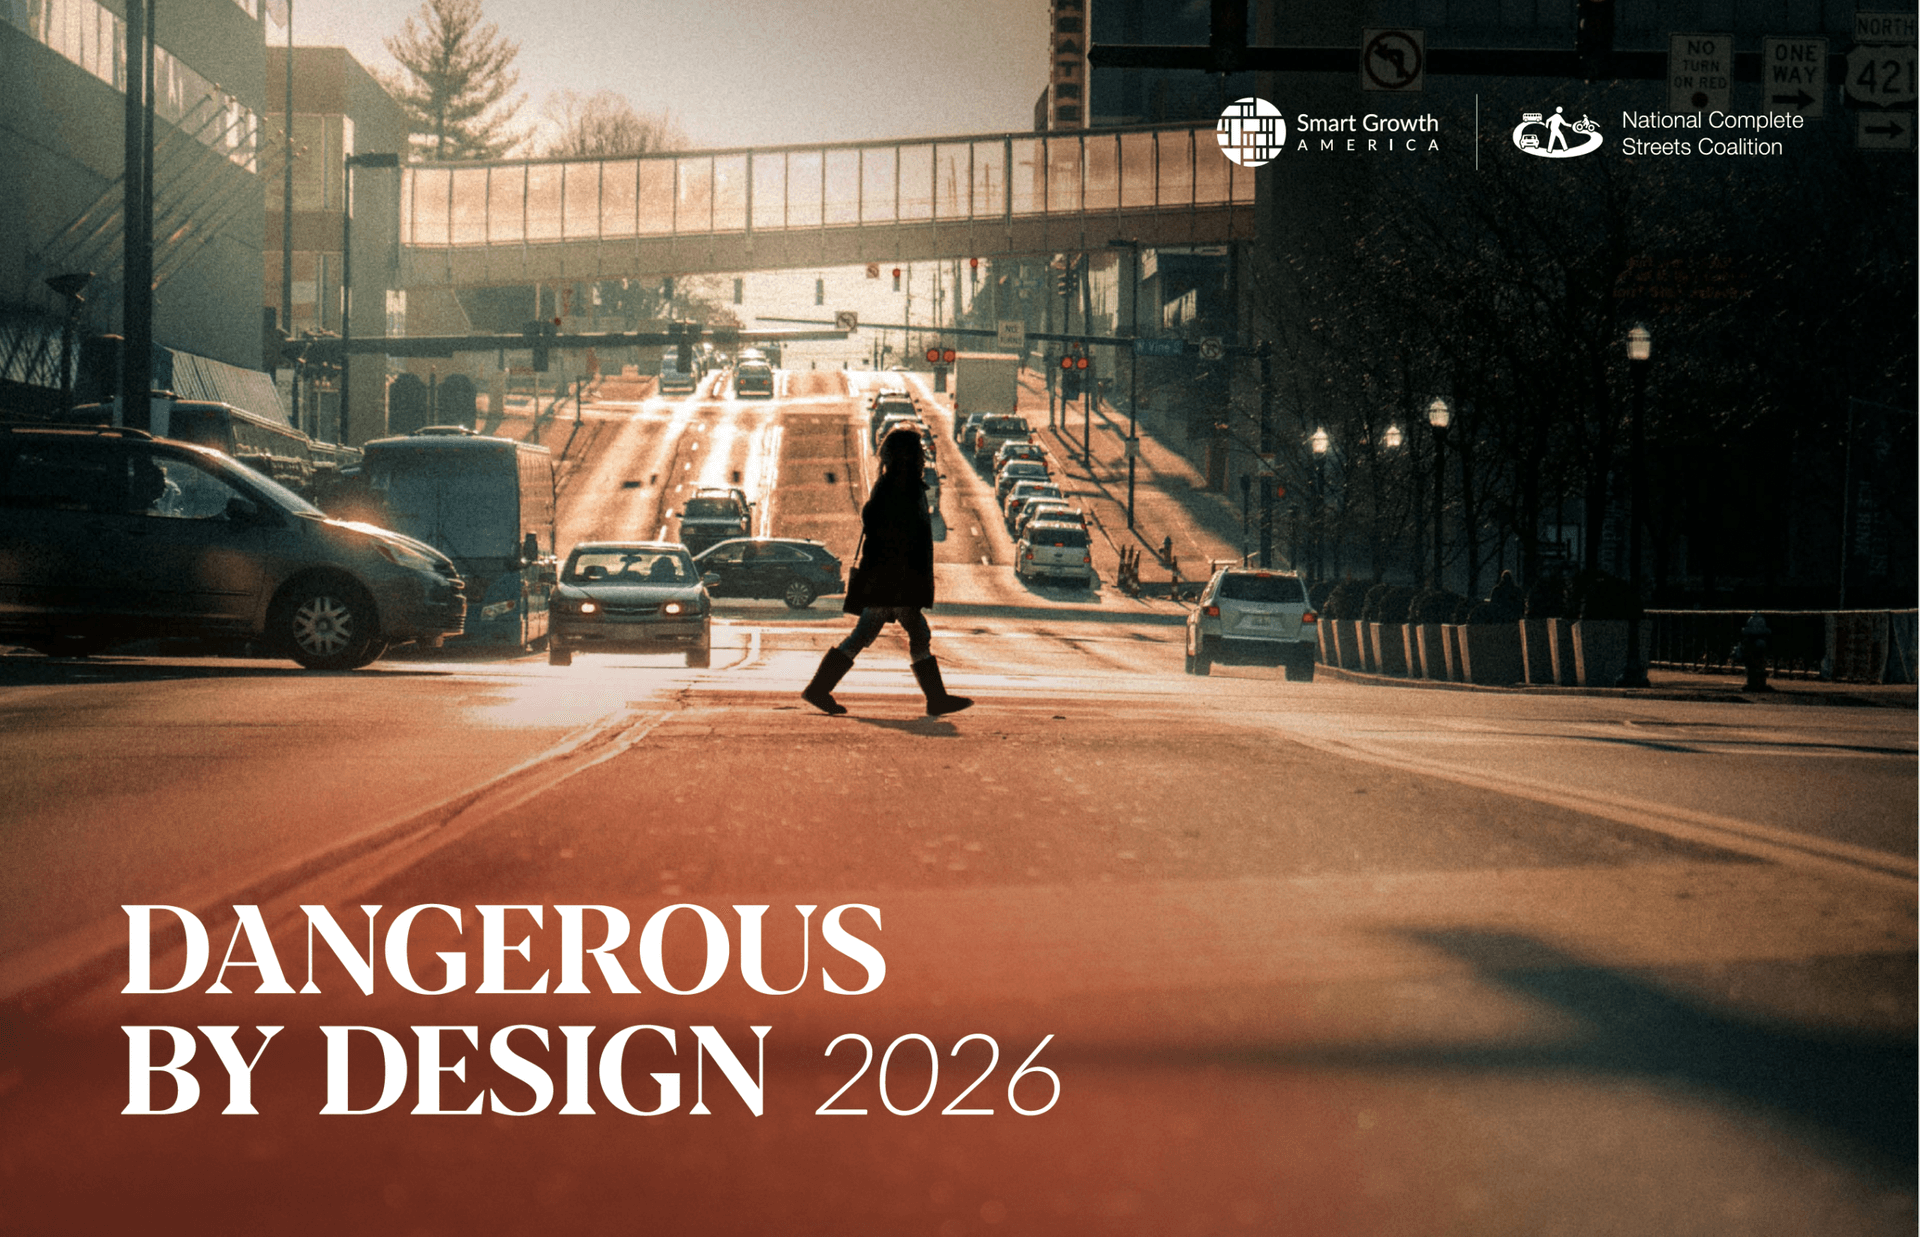
Smart Growth America’s Dangerous by Design 2022 report provides the most up-to-date look at how dangerous state and metro areas are for people walking and sheds light on the deadliest places in the United States based on traffic fatalities from 2016 to 2020.
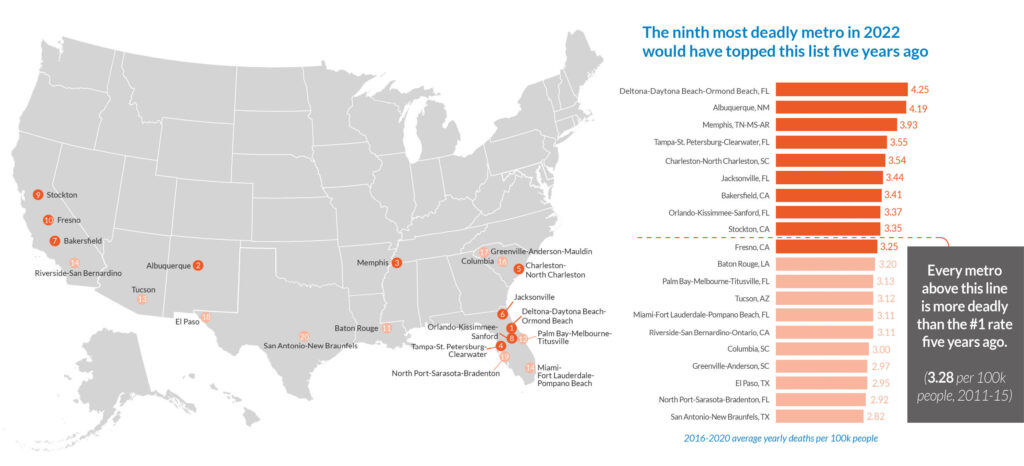
Continuing a troubling trend from the last decade, the report finds that nearly every state and metro area is getting more deadly. Comparing the average fatality rate for the past five years (2016-20) with the previous five years (2011-15), 81 metro areas got worse and only 19 saw lower fatality rates, albeit with marginal decreases.
Dangerous by Design 2022 also takes a close look at how design impacts pedestrian safety. We found what we’ve always known: it’s impossible to prioritize both safety and keeping cars moving quickly. When streets are designed for vehicle speed, pedestrians and other road users pay the price. The COVID pandemic magnified the consequences. As driving decreased, congestion evaporated, removing a barrier that helped reduce vehicle speeds.
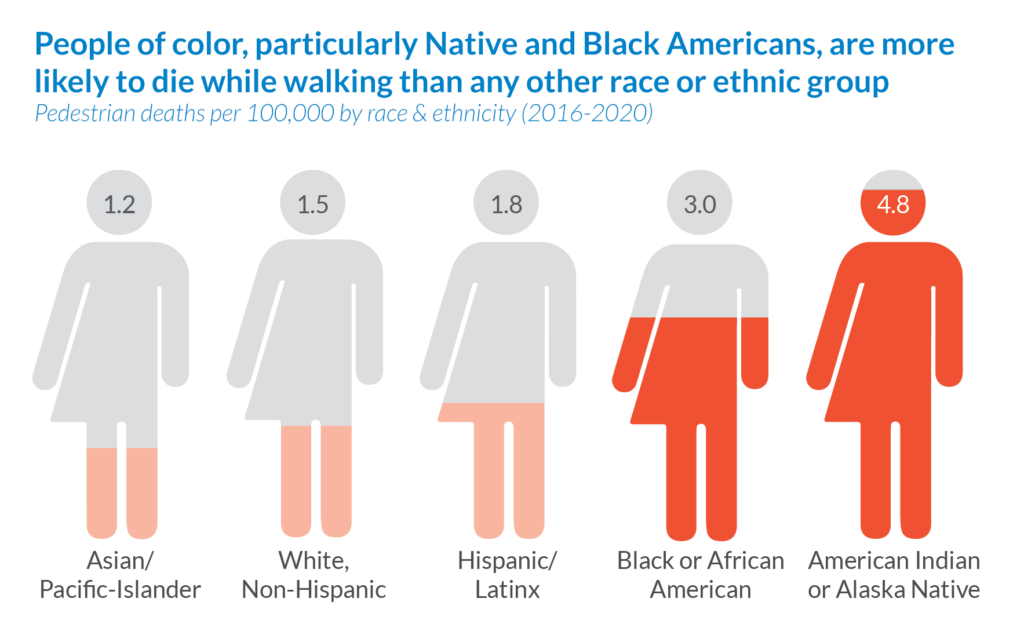
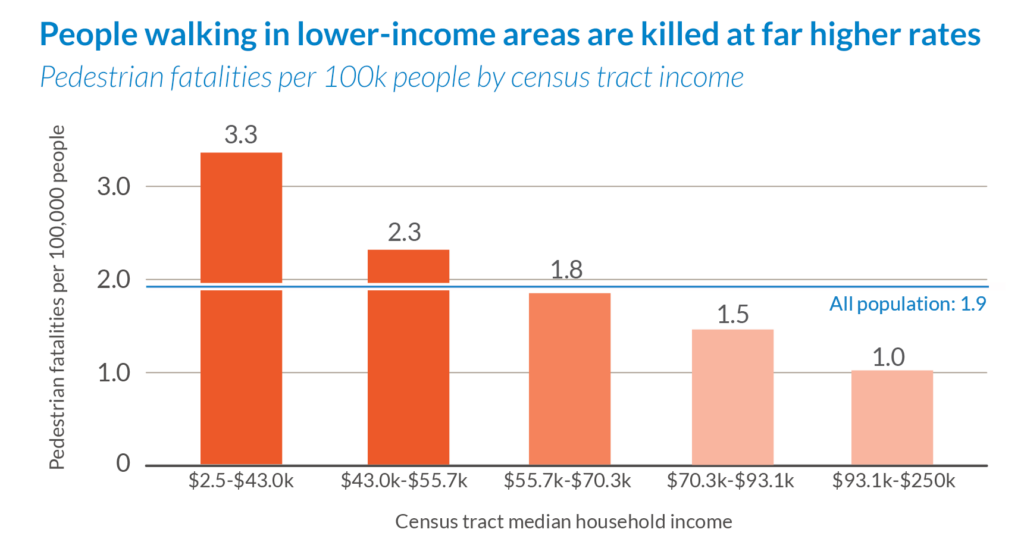
Although everyone is affected by dangerous street design in some way, this burden is not shared equally. Low-income residents, older adults, and people of color are more likely to be struck and killed while walking. Black pedestrians were twice as likely to be killed while walking as white, non-Hispanic pedestrians. Native Americans faced risks nearly three times as great. These statistics also may underestimate the toll, as hundreds of traffic fatalities are reported without race each year
This edition also include a few guest supplements:
- The role engineering plays in dangerous design from Chuck Marohn of Strong Towns
- How to design for slower speeds and safety first from NACTO
- The safety impact of vehicle design from America Walks
- Why safer design is the most effective enforcement solution from Fines & Fees Justice Center
You may be wondering, "what can be done?" The report shares common-sense design interventions that can slow traffic to reasonable speeds and save lives. It also includes recommendations for decision-makers on how to get the most out of the new infrastructure law to make their communities safer for all road users.
Related News


Livable places. Healthy people. Shared prosperity.


© 2026 Smart Growth America. All rights reserved
Site By3Lane Marketing
