News
By Steve Davis, March 10, 2021
The deadliest metro areas and states for people walking have been identified in Dangerous by Design 2021. The number of people struck and killed while walking has gone up 45 percent in a decade, and people of color, older adults, and people walking in low-income neighborhoods were killed at significantly higher rates.
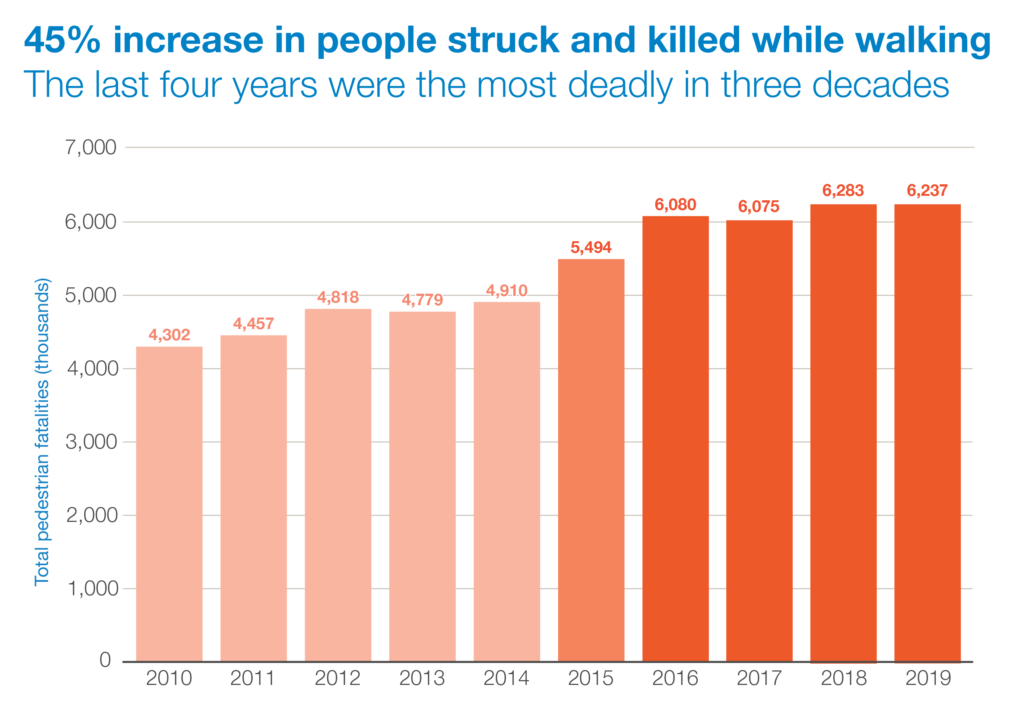
Over the past decade (2010-2019), the number of people struck and killed by drivers nationwide while walking increased by an astonishing 45 percent. The four most recent years on record (2016-2019) are now the four most deadly years for pedestrian deaths since 1990. During this ten-year period, 53,435 people were hit and killed by drivers. In 2019, the 6,237 people struck and killed is the equivalent of more than 17 people killed per day.
The risk is not evenly distributed, which may contribute to the indifference of many policymakers to this astonishing increase: Black Americans, older adults, people walking in low-income communities, and American Indian or Alaska Native people all die at higher rates and face higher levels of risk compared to all Americans. From 2010-2019, Black people were struck and killed by drivers at a 82 percent higher rate than White, non-Hispanic Americans. And the fatality rate for people walking in the lowest income neighborhoods was nearly twice that of middle income census tracts and almost three times that of neighborhoods at higher levels of income (measured in median household income).
The report ranks the 100 most populous metro areas by their “Pedestrian Danger Index,” which accounts for differences in population and walking rates. The top 20 most dangerous are:
1) Orlando-Kissimmee-Sanford, FL
2) Bakersfield, CA
3) Memphis, TN-MS-AR
4) Palm Bay-Melbourne-Titusville, FL
5) Deltona-Daytona Beach-Ormond Beach, FL
6) North Port-Sarasota-Bradenton, FL
7) Jackson, MS
8) Tampa-St. Petersburg-Clearwater, FL
9) Lakeland-Winter Haven, FL
10) Jacksonville, FL
11) Cape Coral-Fort Myers, FL
12) Albuquerque, NM
13) Miami-Fort Lauderdale-Pompano Beach, FL
14) Greenville-Anderson, SC
15) Stockton-Lodi, CA*
16) Baton Rouge, LA
17) Birmingham-Hoover, AL
18) Houston-The Woodlands-Sugar Land, TX*
19) Atlanta-Sandy Springs-Alpharetta, GA*
20) El Paso, TX*
(Metros marked with an *asterisk were not in the top 20 in the 2019 report.) The twenty states with the highest Pedestrian Danger Index ratings are (starting with the highest) Florida, Alabama, New Mexico, Mississippi, Delaware, Louisiana, Arizona, South Carolina, Georgia, Texas, Nevada, Tennessee, North Carolina, Oklahoma, Arkansas, California, Missouri, Maryland, Michigan and Kentucky.

“Our current approach to safety should be judged on the merits; and by any measure, it has been a complete failure,” said Beth Osborne, transportation director for Smart Growth America. "While transportation agencies have done much to avoid doing so, we urgently need to change the way we design and build roads to prioritize safety, not speed, as we currently do. In fact, the obsession with keeping traffic moving and avoiding delay at all costs in hopes of saving drivers mere seconds creates the very dangers highlighted in this report. This is why crosswalks are missing or too far apart, why lanes are too wide, why intersections are difficult to cross on foot, and why money can always be found to widen a road, even when adding sidewalks is deemed ‘too expensive.’”
We continue to design and operate streets that prioritize the speedy movement of vehicles at the expense of safety for all people who use them. There are core tenets of roadway design that are widely accepted but that actively put people at risk and increase the likelihood that people will continue to pay the price. These street design practices can also set drivers up to fail by making it easier to make mistakes with deadly consequences, even when following the rules.
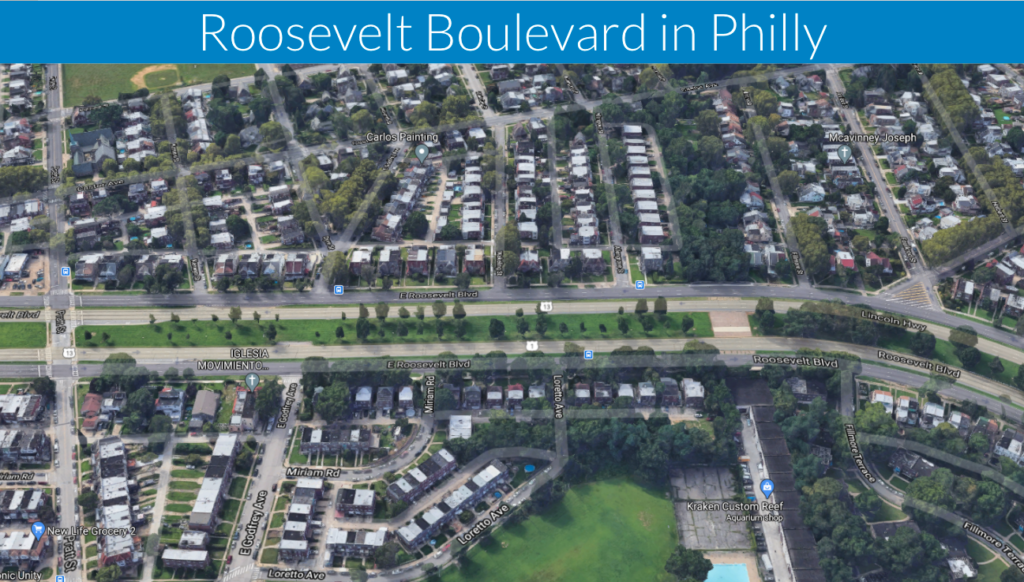
“My niece Samara and three of her four kids were tragically killed on Roosevelt Boulevard in Philadelphia almost 8 years ago,” said Philadelphia resident and victim Latanya Byrd. “But I’m far from alone—dozens of families like mine are left to mourn someone every year because of the way this incredibly dangerous street divides our neighborhoods and makes speeding the norm. When streets are built like Roosevelt—wide, fast, and with few safe places to cross—it is no surprise that drivers are going to speed and people are going to die. How long before our streets are as safe as our leaders claim they want them to be?"
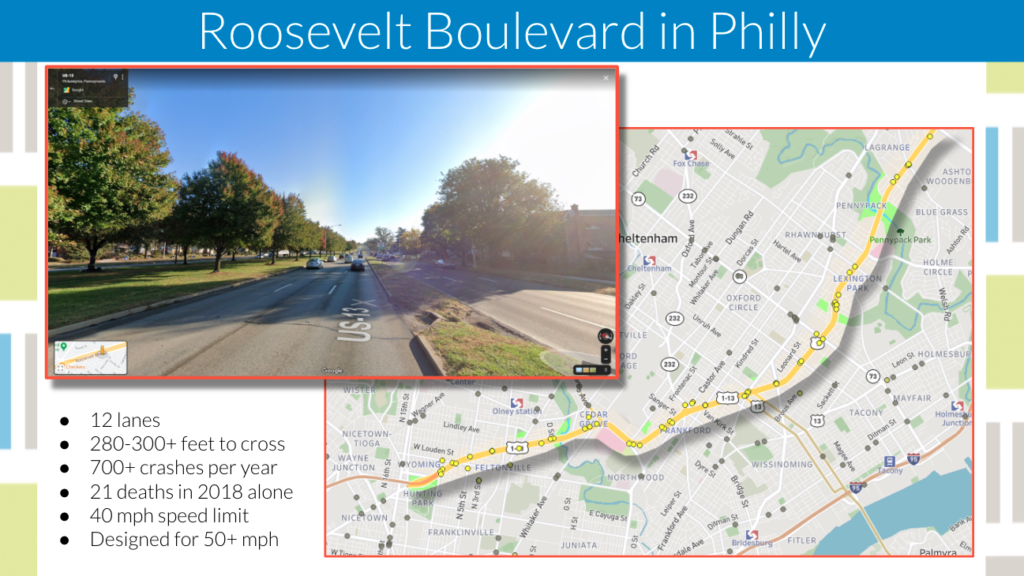
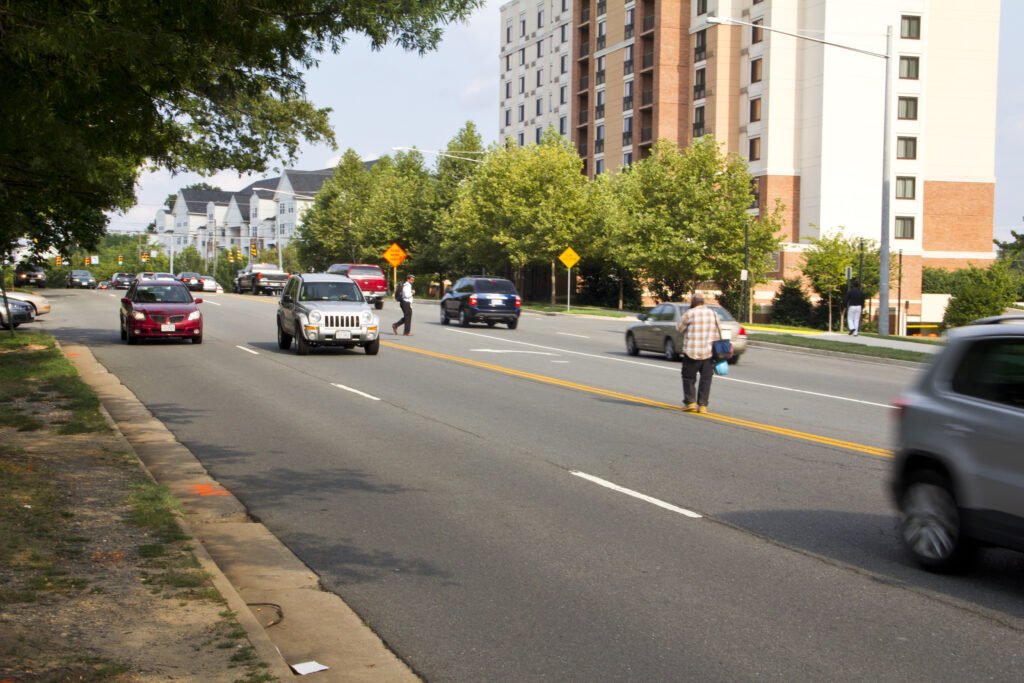
Many places still lack basic essentials that make walking safe. Streets are missing crosswalks and/or don’t provide enough time for older adults to safely cross. Unnecessarily wide lanes on streets filled with destinations and crosswalks spaced too far apart encourage high speeds—a major factor in the likelihood of surviving a collision. Streets are designed with wide turning lanes that allow cars to make right turns through crosswalks at high speeds.
How safety loses out to speed:
View this animation here: smartgrowthamerica.org/safety-or-speed
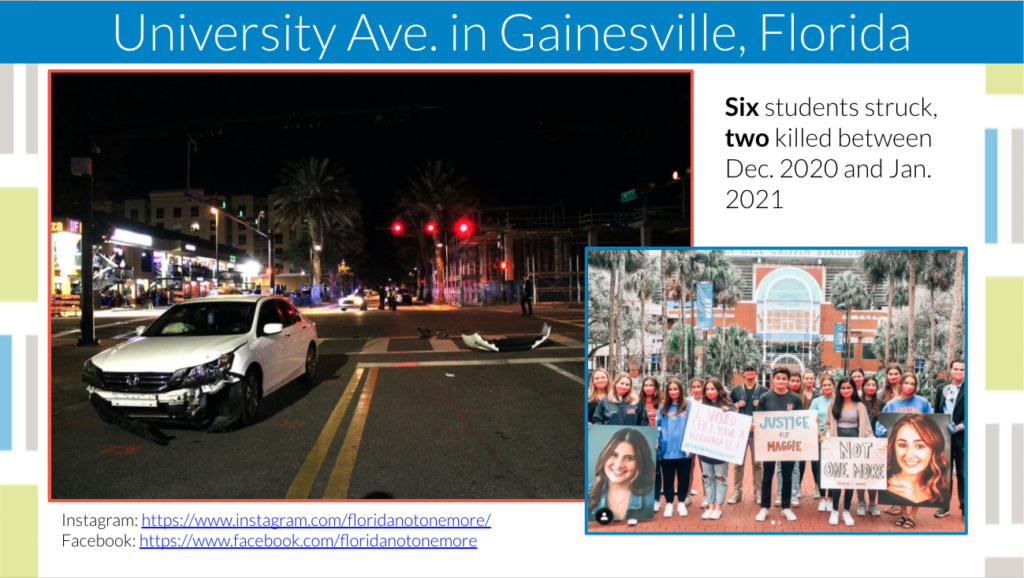
“This past December, my sorority sister Maggie Paxton was killed in a hit and run on University Avenue,” said University of Florida student Kailey Kiss. “Nearly a month later, five students were struck on University Avenue right in front of me and Sophia Lambert was killed. University Avenue, which runs through the heart of the University of Florida’s campus and downtown Gainesville, has a 30 MPH speed limit and sidewalks so narrow that you feel as if you’re walking in the street. Yet literally thousands of students walk along and cross University every day to get to class, eat lunch, or hang out with friends. Not one more life—of any age—should be taken in Florida due to dangerous streets. Florida Not One More serves to give college students a voice on traffic and pedestrian safety, ensuring that Not One More life is taken, and we call on the Florida Department of Transportation and local agencies to prioritize the safety of everyone on our streets through safer designs for slower speeds.”
While the report covers 2010-2019 data, there is a short section on preliminary data about 2020 and the impacts of COVID-19. When congestion disappeared in 2020 due to COVID-19, speeding went up and thousands more people died, even though driving was down. Although USDOT will not release 2020 fatality data until the end of this year at the earliest, the National Safety Council is already estimating a 24 percent spike in (all) traffic fatality rates in 2020—the biggest increase in 96 years—as overall driving dropped precipitously. This is further evidence that congestion may be the only thing keeping these deaths—including people walking—from spiking further. For the states and metro areas in these lists which are unwilling to fully commit to prioritizing safety over speed, congestion might be the (unintentionally) most effective safety tool they have.
“Every traffic death destroys multiple lives, including the victim, the witnesses, and the people who love, did love or will love each of them,” said Drusilla van Hengel, Senior Principal at Nelson/Nygaard. “Smart Growth America’s annual report is a sobering reminder that our system of safety to protect Americans from the pain of traffic violence is broken. NelsonNygaard appreciates the opportunity to partner with SGA on illuminating the need for change.”
The report calls on states, localities, and the federal government to make improving pedestrian safety an urgent priority and identifies actions that can save lives. At the federal level, this includes passing the newly introduced Complete Streets Act, which would require state departments of transportation and metropolitan planning organizations to plan for all people who use the street, including the most vulnerable users. Smart Growth America is asking the public to urge their congressional representatives to stand up for safety by sponsoring the Complete Streets Act.
Long-term federal transportation funding up for reauthorization in 2021 will have a major impact on whether this public health epidemic is addressed or allowed to continue unabated. More money given to states to expand or build new roads with zero requirements to reduce deaths—as exists today—will result in a future Dangerous by Design report that just tells the same story.
As part of the report, there is an interactive map that plots all deaths from 2008-2019. Anyone can type in a U.S. address to see where people have been struck and killed.
Smart Growth America is also hosting a public briefing online on March 25 about the findings.
Related News

© 2026 Smart Growth America. All rights reserved
Site By3Lane Marketing


