Dangerous by Design 2016
Overview
Between 2005 and 2014, a total of 46,149 people were struck and killed by cars while walking in the United States. In 2014, the most recent year for which data are available, 4,884 people were killed by a car while walking—105 people more than in 2013. On average, 13 people were struck and killed by a car while walking every day in 2014. And between 2005 and 2014, Americans were 7.2 times more likely to die as a pedestrian than from a natural disaster. Each one of those people was a child, parent, friend, classmate, or neighbor. And these tragedies are occurring across the country—in small towns and big cities, in communities on the coast and in the heartland.
Dangerous by Design 2016 takes a closer look at this alarming epidemic. The fourth edition once again examines the metro areas that are the most dangerous for people walking. It also includes a racial and income-based examination of the people who are most at risk, and for the first time also ranks states by their danger to pedestrians.
This year’s report ranks the 104 largest metro areas in the country, as well as every state by a “Pedestrian Danger Index,” or PDI. PDI is a calculation of the share of local commuters who walk to work and the most recent data on pedestrian deaths.
Based on PDI, the 20 most dangerous metro areas for walking in the United States are:
| 2016 rank | Metro area | 2016 Pedestrian Danger Index |
|---|---|---|
| 1 | Cape Coral-Fort Myers, FL | 283.1 |
| 2 | Palm Bay-Melbourne-Titusville, FL | 235.2 |
| 3 | Orlando-Kissimmee-Sanford, FL | 234.7 |
| 4 | Jacksonville, FL | 228.7 |
| 5 | Deltona-Daytona Beach-Ormond Beach, FL | 228.2 |
| 6 | Lakeland-Winter Haven, FL | 200.6 |
| 7 | Tampa-St. Petersburg-Clearwater, FL | 192.0 |
| 8 | Jackson, MS | 189.6 |
| 9 | Memphis, TN-MS-AR | 153.3 |
| 10 | North Port-Sarasota-Bradenton, FL | 148.2 |
| 11 | Miami-Fort Lauderdale-West Palm Beach, FL | 145.1 |
| 12 | Bakersfield, CA | 132.8 |
| 13 | Birmingham-Hoover, AL | 132.1 |
| 14 | Little Rock-North Little Rock-Conway, AR | 127.9 |
| 15 | Houston-The Woodlands-Sugar Land, TX | 127.2 |
| 16 | Phoenix-Mesa-Scottsdale, AZ | 125.1 |
| 17 | Detroit-Warren-Dearborn, MI | 124.2 |
| 18 | Riverside-San Bernardino-Ontario, CA | 123.4 |
| 19 | Baton Rouge, LA | 120.6 |
| 20 | McAllen-Edinburg-Mission, TX | 118.8 |
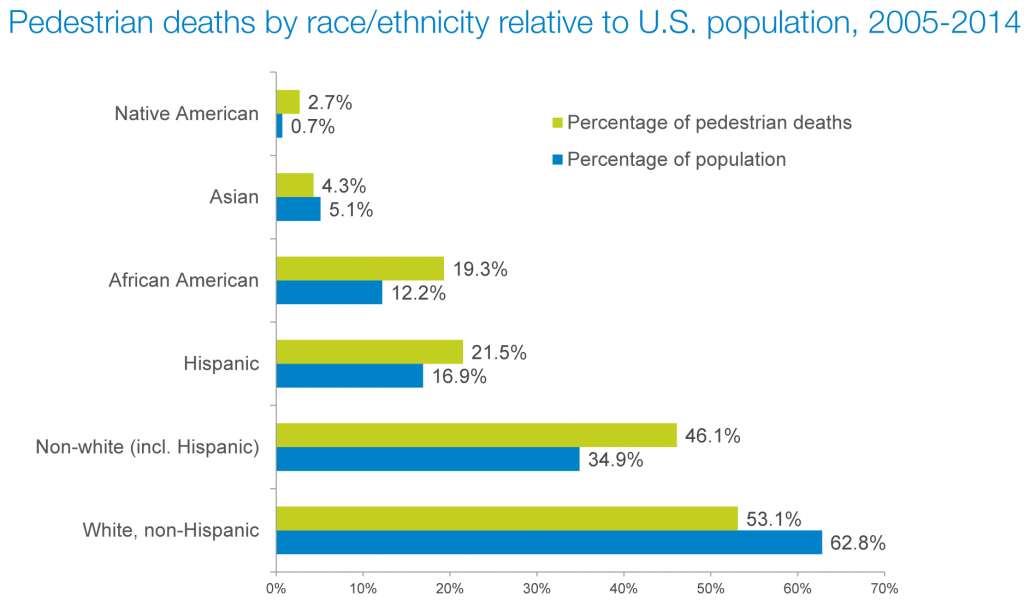
Who are the victims of these collisions? People of color and older adults are overrepresented among pedestrian deaths. Non-white individuals account for 34.9 percent of the national population but make up 46.1 percent of pedestrian deaths. In some states, this disparity is even starker. In North Dakota, for example, Native Americans make up just five percent of the population but account for almost 38 percent of pedestrian deaths. Older adults are similarly at higher risk: individuals 65 years or older are 50 percent more likely than younger individuals to be struck and killed by a car while walking. Even after controlling for the relative amounts of walking among these populations, risks continue to be higher for some people of color and older adults—indicating that these people most likely face disproportionately unsafe conditions for walking.
In addition, PDI is correlated with median household income and rates of uninsured individuals. Low-income metro areas are predictably more dangerous than higher-income ones: as median household incomes drop, PDI rises. Similar trends bear out with rates of uninsured individuals: as rates of uninsured individuals rise, so do PDIs, meaning that the people who can least afford to be injured often live in the most dangerous places.
The way we design streets is a factor in these fatal collisions. Many of these deaths occur on streets with fast-moving cars and poor pedestrian infrastructure. People walk along these roads despite the clear safety risks—a sign that streets are not adequately serving everyone in the community.
Everyone involved in the street design process—from federal policymakers to local elected leaders to transportation engineers—must take action to end pedestrian deaths. So long as streets are built to prioritize high speeds at the cost of pedestrian safety, this will remain a problem. And as the nation’s population grows older on the whole, and as we become more diverse both racially and economically, the need for these safety improvements will only become more dire in years to come.
Policy makers at the local, state, and national level can and must take action to protect people from being struck and killed by cars while walking. Dangerous by Design 2016 outlines where to focus these actions and the first steps to making it happen.
Where are the dangerous streets near you?
Two interactive maps explore pedestrian fatality data in more detail.
The first plots every pedestrian fatality from 2005-2014. Zoom in and drag, or search for any U.S. address using the address bar box in the top right corner. Clicking any icon will bring up any available details about that fatality.
The second is a heat map of pedestrian fatalities, which makes more clear where multiple collisions have occurred.
Maps were generated using data from the Fatality Analysis Reporting System, provided by the National Highway Transportation Safety Administration. A total of 723 fatalities from 2005-2014 were excluded due to poor location data.
Metro-area rankings and data
This table below shows the Pedestrian Danger Index (PDI) and other fatality statistics for each of the 104 largest metro areas (defined by the Census Bureau) in the country.
- The higher a metro area’s PDI, the more dangerous it is for people walking.
- Tables are sortable by any column, but default to sorting by the highest PDI (most dangerous) first.
| 2016 rank | Metro area | Total pedestrian deaths (2005-2014) | Annual pedestrian fatalities per 100k people | 2016 Pedestrian Danger Index |
|---|---|---|---|---|
| 1 | Cape Coral-Fort Myers, FL | 165 | 2.55 | 283.1 |
| 2 | Palm Bay-Melbourne-Titusville, FL | 142 | 2.59 | 235.2 |
| 3 | Orlando-Kissimmee-Sanford, FL | 575 | 2.58 | 234.7 |
| 4 | Jacksonville, FL | 379 | 2.74 | 228.7 |
| 5 | Deltona-Daytona Beach-Ormond Beach, FL | 191 | 3.19 | 228.2 |
| 6 | Lakeland-Winter Haven, FL | 161 | 2.61 | 200.6 |
| 7 | Tampa-St. Petersburg-Clearwater, FL | 821 | 2.88 | 192 |
| 8 | Jackson, MS | 109 | 1.9 | 189.6 |
| 9 | Memphis, TN-MS-AR | 246 | 1.84 | 153.3 |
| 10 | North Port-Sarasota-Bradenton, FL | 150 | 2.08 | 148.2 |
| 11 | Miami-Fort Lauderdale-West Palm Beach, FL | 1,508 | 2.61 | 145.1 |
| 12 | Bakersfield, CA | 205 | 2.39 | 132.8 |
| 13 | Birmingham-Hoover, AL | 150 | 1.32 | 132.1 |
| 14 | Little Rock-North Little Rock-Conway, AR | 110 | 1.53 | 127.9 |
| 15 | Houston-The Woodlands-Sugar Land, TX | 1,026 | 1.65 | 127.2 |
| 16 | Phoenix-Mesa-Scottsdale, AZ | 814 | 1.88 | 125.1 |
| 17 | Detroit-Warren-Dearborn, MI | 693 | 1.61 | 124.2 |
| 18 | Riverside-San Bernardino-Ontario, CA | 858 | 1.97 | 123.4 |
| 19 | Baton Rouge, LA | 167 | 2.05 | 120.6 |
| 20 | McAllen-Edinburg-Mission, TX | 115 | 1.43 | 118.8 |
| 21 | Las Vegas-Henderson-Paradise, NV | 401 | 2 | 117.7 |
| 22 | Augusta-Richmond County, GA-SC | 119 | 2.07 | 114.8 |
| 23 | Albuquerque, NM | 194 | 2.16 | 113.6 |
| 24 | Tulsa, OK | 137 | 1.44 | 110.5 |
| 25 | Dallas-Fort Worth-Arlington, TX | 888 | 1.32 | 110.4 |
| 26 | Atlanta-Sandy Springs-Roswell, GA | 819 | 1.5 | 107.2 |
| 27 | Raleigh, NC | 165 | 1.39 | 106.7 |
| 28 | San Antonio-New Braunfels, TX | 421 | 1.88 | 104.5 |
| 29 | Stockton-Lodi, CA | 137 | 1.95 | 102.9 |
| 30 | Modesto, CA | 96 | 1.84 | 102 |
| 31 | Greenville-Anderson-Mauldin, SC | 162 | 1.92 | 101.2 |
| 32 | Winston-Salem, NC | 84 | 1.3 | 99.7 |
| 33 | Charlotte-Concord-Gastonia, NC-SC | 317 | 1.38 | 98.5 |
| 34 | Louisville/Jefferson County, KY-IN | 194 | 1.55 | 96.7 |
| 35 | Greensboro-High Point, NC | 106 | 1.44 | 96 |
| 36 | Fresno, CA | 190 | 2 | 95.4 |
| 37 | Nashville-Davidson-Murfreesboro-Franklin, TN | 209 | 1.21 | 92.9 |
| 38 | New Orleans-Metairie, LA | 272 | 2.22 | 88.7 |
| 39 | El Paso, TX | 158 | 1.91 | 86.8 |
| 40 | Oklahoma City, OK | 180 | 1.39 | 86.7 |
| 41 | Knoxville, TN | 87 | 1.03 | 85.5 |
| 42 | Tucson, AZ | 197 | 1.98 | 82.6 |
| 43 | Sacramento-Roseville-Arden-Arcade, CA | 375 | 1.71 | 81.3 |
| 44 | Richmond, VA | 150 | 1.22 | 81 |
| 45 | Kansas City, MO-KS | 210 | 1.03 | 79.2 |
| 46 | Charleston-North Charleston, SC | 152 | 2.18 | 77.9 |
| 47 | Austin-Round Rock, TX | 257 | 1.4 | 77.8 |
| 48 | San Jose-Sunnyvale-Santa Clara, CA | 271 | 1.43 | 75.1 |
| 49 | Ogden-Clearfield, UT | 64 | 1.04 | 74.4 |
| 50 | Indianapolis-Carmel-Anderson, IN | 216 | 1.12 | 69.9 |
| 51 | Los Angeles-Long Beach-Anaheim, CA | 2,370 | 1.81 | 69.8 |
| 52 | St. Louis, MO-IL | 351 | 1.25 | 69.7 |
| 53 | Wichita, KS | 61 | 0.96 | 68.5 |
| 54 | Youngstown-Warren-Boardman, OH-PA | 64 | 1.14 | 67.3 |
| 55 | Baltimore-Columbia-Towson, MD | 470 | 1.71 | 65.7 |
| 56 | San Diego-Carlsbad, CA | 559 | 1.76 | 62.7 |
| 57 | Columbia, SC | 162 | 2.06 | 62.6 |
| 58 | Denver-Aurora-Lakewood, CO | 327 | 1.23 | 58.7 |
| 59 | Chattanooga, TN-GA | 58 | 1.08 | 56.8 |
| 60 | Oxnard-Thousand Oaks-Ventura, CA | 91 | 1.09 | 54.4 |
| NATIONAL TOTAL (Of 104 largest metros) | 31,701 | 1.51 | 53.8 | |
| 61 | Salt Lake City, UT | 125 | 1.11 | 53 |
| 62 | Grand Rapids-Wyoming, MI | 103 | 1.02 | 51.1 |
| 63 | Des Moines-West Des Moines, IA | 47 | 0.8 | 49.7 |
| 64 | Toledo, OH | 76 | 1.25 | 48 |
| 65 | Allentown-Bethlehem-Easton, PA-NJ | 102 | 1.23 | 47.5 |
| 66 | Columbus, OH | 198 | 1.02 | 46.2 |
| 67 | Akron, OH | 55 | 0.78 | 46 |
| 68 | Philadelphia-Camden-Wilmington, PA-NJ-DE-MD | 979 | 1.63 | 44 |
| 69 | Washington-Arlington-Alexandria, DC-VA-MD-WV | 817 | 1.39 | 43.5 |
| 70 | Durham-Chapel Hill, NC | 72 | 1.37 | 42.9 |
| 71 | Scranton-Wilkes-Barre-Hazleton, PA | 84 | 1.49 | 42.7 |
| 72 | Buffalo-Cheektowaga-Niagara Falls, NY | 134 | 1.18 | 40.7 |
| 73 | Hartford-West Hartford-East Hartford, CT | 130 | 1.07 | 39.6 |
| 74 | Milwaukee-Waukesha-West Allis, WI | 169 | 1.08 | 38.6 |
| 75 | Providence-Warwick, RI-MA | 195 | 1.22 | 38 |
| 76 | Cincinnati, OH-KY-IN | 168 | 0.79 | 37.5 |
| 77 | Virginia Beach-Norfolk-Newport News, VA-NC | 189 | 1.11 | 37.1 |
| 78 | Harrisburg-Carlisle, PA | 69 | 1.24 | 35.5 |
| 79 | Dayton, OH | 71 | 0.89 | 35.4 |
| 80 | Chicago-Naperville-Elgin, IL-IN-WI | 1,043 | 1.1 | 34.2 |
| 81 | Bridgeport-Stamford-Norwalk, CT | 86 | 0.92 | 34.1 |
| 82 | Urban Honolulu, HI | 172 | 1.76 | 33.9 |
| 83 | New Haven-Milford, CT | 103 | 1.19 | 33.1 |
| 84 | Worcester, MA-CT | 82 | 0.89 | 31.7 |
| 85 | San Francisco-Oakland-Hayward, CA | 618 | 1.38 | 31.4 |
| 86 | Portland-Vancouver-Hillsboro, OR-WA | 251 | 1.1 | 31.3 |
| 87 | Boise City, ID | 40 | 0.63 | 31.3 |
| 88 | Cleveland-Elyria, OH | 138 | 0.67 | 30.3 |
| 89 | Spokane-Spokane Valley, WA | 48 | 0.9 | 30 |
| 90 | Omaha-Council Bluffs, NE-IA | 47 | 0.53 | 29.5 |
| 91 | Rochester, NY | 113 | 1.04 | 29 |
| 92 | Springfield, MA | 71 | 1.13 | 28.3 |
| 93 | Minneapolis-St. Paul-Bloomington, MN-WI | 222 | 0.65 | 28.2 |
| 94 | Albany-Schenectady-Troy, NY | 90 | 1.03 | 27.8 |
| 95 | New York-Newark-Jersey City, NY-NJ-PA | 3,216 | 1.62 | 27 |
| 96 | Pittsburgh, PA | 213 | 0.9 | 26.6 |
| 97 | Seattle-Tacoma-Bellevue, WA | 316 | 0.89 | 24.7 |
| 98 | Lancaster, PA | 45 | 0.85 | 24.4 |
| 99 | Syracuse, NY | 70 | 1.06 | 23 |
| 100 | Provo-Orem, UT | 44 | 0.8 | 19.5 |
| 101 | Boston-Cambridge-Newton, MA-NH | 444 | 0.95 | 18 |
| 102 | Madison, WI | 53 | 0.85 | 16.4 |
| 103 | Portland-South Portland, ME | 30 | 0.58 | 14.8 |
| 104 | Colorado Springs, CO | 37 | 0.55 | 13.5 |
State-level rankings and data
In addition to metro areas, this year Dangerous by Design also examined statewide PDI for the first time. This table below shows the PDI for all 50 states and the District of Columbia, as well as other pieces of data to round out the picture at the state level.
| 2016 rank | State | Total pedestrian deaths (2005-2014) | Annual pedestrian fatalities per 100k people | 2016 Pedestrian Danger Index |
|---|---|---|---|---|
| 1 | Florida | 5,142 | 2.66 | 177 |
| 2 | Alabama | 724 | 1.5 | 136.6 |
| 3 | Louisiana | 1,024 | 2.23 | 117.1 |
| 4 | Mississippi | 545 | 1.83 | 114.1 |
| 5 | New Mexico | 516 | 2.48 | 112.8 |
| 6 | Arizona | 1,424 | 2.17 | 108.5 |
| 7 | South Carolina | 1,057 | 2.24 | 106.5 |
| 8 | Delaware | 207 | 2.26 | 102.6 |
| 9 | Texas | 4,219 | 1.62 | 101.1 |
| 10 | Georgia | 1,555 | 1.57 | 98.1 |
| 11 | North Carolina | 1,690 | 1.73 | 96.3 |
| 12 | Nevada | 529 | 1.92 | 91.2 |
| 13 | Tennessee | 759 | 1.18 | 90.5 |
| 14 | Arkansas | 404 | 1.37 | 80.6 |
| 15 | Maryland | 1,053 | 1.79 | 77.8 |
| 16 | Oklahoma | 523 | 1.37 | 76.1 |
| 17 | California | 6,616 | 1.74 | 64.4 |
| 18 | Michigan | 1,328 | 1.34 | 61 |
| 19 | Missouri | 726 | 1.2 | 60.2 |
| 20 | New Jersey | 1,493 | 1.68 | 56.1 |
| 21 | Kentucky | 529 | 1.21 | 54.9 |
| NATIONAL TOTAL | 46,149 | 1.47 | 52.5 | |
| 22 | Indiana | 636 | 0.97 | 46.3 |
| 23 | West Virginia | 216 | 1.17 | 41.6 |
| 24 | Virginia | 813 | 0.99 | 41.4 |
| 25 | Utah | 278 | 0.97 | 38.9 |
| 26 | Hawaii | 251 | 1.8 | 38.3 |
| 27 | Ohio | 964 | 0.83 | 36.3 |
| 28 | Connecticut | 376 | 1.05 | 34.9 |
| 29 | Illinois | 1,356 | 1.05 | 34 |
| 30 | Colorado | 525 | 1.01 | 33.7 |
| 31 | Rhode Island | 126 | 1.2 | 32.3 |
| 32 | Oregon | 491 | 1.26 | 30.7 |
| 33 | Kansas | 211 | 0.73 | 30.5 |
| 34 | Pennsylvania | 1,510 | 1.18 | 30.3 |
| 35 | Montana | 131 | 1.3 | 27.1 |
| 36 | Washington | 641 | 0.93 | 26.5 |
| 37 | Wisconsin | 484 | 0.85 | 25.6 |
| 38 | New York | 3,007 | 1.53 | 24 |
| 39 | Idaho | 114 | 0.71 | 23.8 |
| 40 | South Dakota | 78 | 0.93 | 22.8 |
| 41 | Minnesota | 341 | 0.63 | 22.6 |
| 42 | North Dakota | 61 | 0.87 | 22.2 |
| 43 | New Hampshire | 85 | 0.64 | 22.2 |
| 44 | Massachusetts | 693 | 1.04 | 22.1 |
| 45 | Wyoming | 48 | 0.83 | 22 |
| 46 | Maine | 103 | 0.78 | 19.9 |
| 47 | Iowa | 212 | 0.69 | 19.7 |
| 48 | Nebraska | 90 | 0.49 | 17.3 |
| 49 | District of Columbia | 121 | 1.91 | 15.4 |
| 50 | Alaska | 84 | 1.15 | 14.6 |
| 51 | Vermont | 40 | 0.64 | 11.4 |
Who is most at risk?
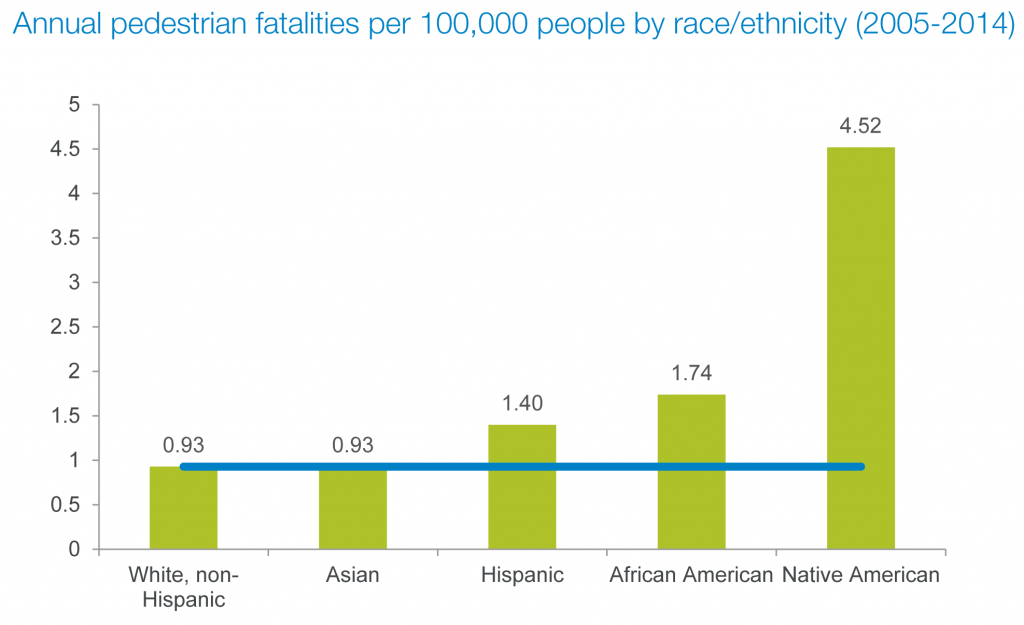
People of color and older adults are overrepresented among pedestrian deaths, and PDI is correlated with median household income and rates of uninsured individuals. Specifically, Native Americans and African Americans, as well as adults 65 years and older, are all at much higher risk of being struck and killed by a car while walking than people in other demographics.
People of color are less likely to own a personal vehicle, increasing their likelihood of walking. Poor neighborhoods and communities of color also have some of the most dangerous pedestrian infrastructure. This fact is reflected in the number of pedestrian deaths that are people of color. In 2014, 34.9 percent of the United States population identified as non-white or Hispanic, yet these groups accounted for 46.1 percent of all pedestrian deaths between 2005 and 2014.
Even after controlling for the relative amounts of walking among these populations, risks continue to be higher for some people of color and older adults—indicating that these people most likely face disproportionately unsafe conditions for walking. To understand the risks for ethnic, racial and elderly groups after controlling for exposure, a national Pedestrian Danger Index was developed
for each racial and ethnic group as well as by age.
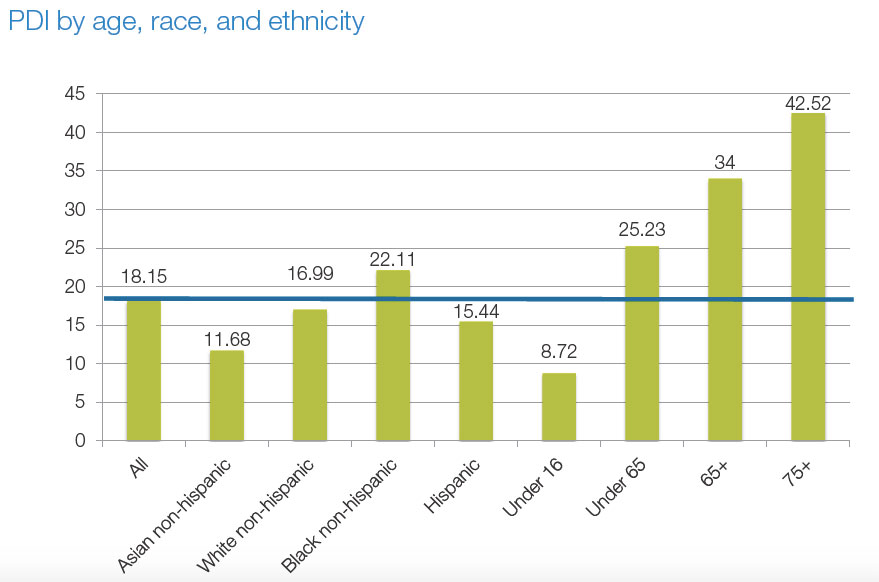
As that figure shows, the analysis adjusting for walk rates and exposure shows the Black Non-Hispanic community demonstrates a higher PDI than the population as a whole. PDI is significantly higher than average for individuals over 65 years old, and even higher for individuals over 75.
These deaths happen everywhere—in small towns and big cities, in communities on the coasts and in the heartland—but most notably, at the metro area level, median household income and PDI are negatively correlated. This means that the lower a metro area’s median household income, the more dangerous its streets are likely to be for people walking. Similarly, the rate of uninsured people is also strongly correlated with a metro area’s PDI, meaning that the places where people are most likely to lack access to high-quality medical care are also the places where people are likely to be struck and killed by a car while walking.
The table below shows the annual fatalities per 100,000 people between 2005 and 2014, and the relative risk of pedestrian death for non-white compared to white individuals. And it shows that non-white individuals are overrepresented in pedestrian deaths in 42 out of 49 states and the District of Columbia.
| State | Percentage of population, non-white | Percentage of pedestrian deaths - nonwhite | Pedestrian fatalities per 100k - white | Pedestrian fatalities per 100k - non-white | Relative risk |
|---|---|---|---|---|---|
| Louisiana | 38.7% | 85.4% | 0.26 | 2.36 | 9.03 |
| South Dakota | 14.1% | 54.9% | 0.46 | 3.31 | 7.21 |
| North Dakota | 10.4% | 41.1% | 0.53 | 3.14 | 5.89 |
| Montana | 10.6% | 32.2% | 0.89 | 3.48 | 3.91 |
| Alaska* | 29.8% | 64.3% | 0.55 | 2.07 | 3.8 |
| Texas | 54.1% | 77.8% | 0.43 | 1.23 | 2.87 |
| Michigan* | 21.6% | 41.3% | 0.81 | 2 | 2.49 |
| District of Columbia* | 62.4% | 78.4% | 0.98 | 2.02 | 2.06 |
| Arizona | 41.1% | 58.8% | 1.1 | 2.17 | 1.97 |
| Wisconsin | 15.5% | 26.8% | 0.65 | 1.27 | 1.95 |
| Colorado | 28.2% | 44.1% | 0.72 | 1.4 | 1.94 |
| Wyoming | 13.3% | 23.3% | 0.68 | 1.3 | 1.93 |
| Missouri | 17.3% | 28.8% | 0.95 | 1.78 | 1.88 |
| Utah | 18.3% | 30.0% | 0.58 | 1.09 | 1.87 |
| New Mexico | 58.7% | 72.1% | 1.5 | 2.63 | 1.75 |
| Georgia | 43.2% | 56.8% | 0.61 | 1.03 | 1.68 |
| Alabama | 31.9% | 44.5% | 1.12 | 1.87 | 1.67 |
| Oklahoma* | 25.3% | 38.2% | 1.04 | 1.71 | 1.66 |
| South Carolina | 34.3% | 46.8% | 1.67 | 2.73 | 1.64 |
| Arkansas | 24.2% | 34.7% | 1.07 | 1.74 | 1.62 |
| Indiana | 17.3% | 25.4% | 0.6 | 0.96 | 1.6 |
| Tennessee | 23.2% | 32.8% | 0.94 | 1.48 | 1.58 |
| Nebraska | 16.9% | 24.4% | 0.41 | 0.64 | 1.55 |
| National total | 34.9% | 46.1% | 0.93 | 1.44 | 1.54 |
| Ohio | 17.3% | 24.3% | 0.69 | 1.03 | 1.49 |
| North Carolina | 33.4% | 43.4% | 1.36 | 2.02 | 1.49 |
| Virginia* | 33.4% | 43.4% | 0.67 | 0.98 | 1.47 |
| Illinois* | 35.4% | 43.9% | 0.72 | 1 | 1.39 |
| Mississippi | 41.3% | 49.6% | 1.43 | 1.95 | 1.37 |
| Minnesota* | 15.5% | 20.2% | 0.5 | 0.67 | 1.34 |
| Hawaii | 57.9% | 77.1% | 1.6 | 2.13 | 1.33 |
| Kansas | 19.9% | 24.2% | 0.65 | 0.8 | 1.24 |
| Idaho* | 14.7% | 17.9% | 0.59 | 0.72 | 1.24 |
| Iowa* | 10.6% | 12.4% | 0.57 | 0.68 | 1.18 |
| Washington | 24.5% | 28.2% | 0.83 | 0.95 | 1.14 |
| Rhode Island* | 22.0% | 24.8% | 1 | 1.12 | 1.12 |
| New Jersey* | 40.2% | 43.3% | 1.22 | 1.34 | 1.1 |
| Kentucky | 12.4% | 13.6% | 1.05 | 1.14 | 1.09 |
| New Hampshire* | 6.6% | 7.2% | 0.53 | 0.57 | 1.08 |
| Massachusetts* | 22.5% | 24.3% | 0.87 | 0.93 | 1.07 |
| California | 57.9% | 60.2% | 1.53 | 1.57 | 1.02 |
| Maryland* | 43.9% | 45.5% | 1.35 | 1.38 | 1.02 |
| Florida | 41.5% | 42.5% | 2.37 | 2.4 | 1.01 |
| Connecticut* | 28.0% | 27.8% | 0.89 | 0.86 | 0.96 |
| New York | 40.6% | 39.3% | 0.71 | 0.65 | 0.92 |
| Oregon | 19.0% | 16.7% | 1.22 | 1 | 0.82 |
| West Virginia | 5.3% | 4.3% | 1.04 | 0.81 | 0.78 |
| Delaware | 33.3% | 27.2% | 2.36 | 1.7 | 0.72 |
| Nevada* | 44.1% | 36.6% | 1.9 | 1.31 | 0.69 |
| Maine* | 4.1% | 2.3% | 0.67 | 0.36 | 0.54 |
| Vermont | 4.3% | 0.0% | 0.61 | 0 | 0 |
*Missing >15% of fatalities with incomplete race/ethnicity data
†Missing >30% of fatalities with incomplete race/ethnicity data
Pennsylvania excluded from chart, >90 percent of fatalities lack race/ethnicity data
Note that this table excludes 11,963 pedestrian fatalities (25.9 percent of all fatalities between 2005 and 2014) for incomplete race/ethnicity data.
Take action
Sponsor the next edition of Dangerous by Design
Dangerous by Design is one of the most effective ways we have to make our streets safer for all people. However, we need your help to get this report into the hands of advocates who can help put it to use. With your help, the goal of creating streets that are safe for all users is in sight. Your support will help us achieve even more this year. Become an individual or institutional sponsor of Dangerous by Design now, and together we can keep fighting to continue the progress we’ve made.
Tell the incoming Secretary of Transportation to take pedestrian deaths seriously
With the Trump administration’s Secretary of Transportation designee facing a confirmation hearing before a Senate committee this week on Capitol Hill, we have a huge opportunity to shine a spotlight on this issue. Send a message to the Senate Commerce Committee staff urging them to press Elaine Chao on this issue during her confirmation hearing on Wednesday, January 11.
—
Dangerous by Design 2016 was made possible by the support of AARP, the American Society of Landscape Architects, and Nelson\Nygaard Consulting Associates.