


News
By Miguel Rodríguez, April 11, 2025
Lead researcher and author: Dr. Michael Rodriguez
With support from Kate Southerland, Katharine Burgess, and Eric Cova
Opening up federal lands for development may sound like a promising fix for the housing crisis. But our analysis shows that very little of this land is located in places where new housing is needed most. Instead, strategies like infill development, missing middle housing, and zoning reform offer far greater potential to deliver the level of housing needed in places where people actually want to live.
HUD Secretary Scott Turner and Interior Secretary Doug Burgum recently argued that unlocking federal land is a possible game-changer for America’s housing crisis, an idea echoed by urban researcher Joel Kotkin. HUD is now establishing a Joint Task Force on Federal Land for Housing, which will “pinpoint where housing needs are most pressing and guide the process by working with state and local leaders who know their communities best.” While the Trump administration is moving forward with this strategy, it is worth noting that the idea of developing underutilized federal land isn’t new. To better understand the potential impact of this policy, we explored data about where these federal lands–a term used here to mean land managed by the Bureau of Land Management, the Bureau of Reclamation, the Fish and Wildlife Service, and the Forest Service commonly referred to by that name rather than federal properties such as those held by agencies as office buildings or utilized for other functions–are located. We find that, despite the optimism associated with the concept, very little federal land lies in the main commuting zones of America’s largest metro areas.
Increasing housing supply is crucial, and the U.S. needs every available tool to address its deep housing crisis—especially in well-connected, vibrant locations. There is a housing crisis in the United States: nearly half of renter households spend more than 30% of their income on housing, and the average homeowning household spends 42% of their income on mortgage payments. The most cost-burdened large metro areas are in an even more significant crisis, according to 2023 Census data: 63% of renters in Miami, FL, spend over 30% of their income on housing, 58% in Riverside, CA, and 57% in Orlando, FL. The nature of the crisis requires a focus on immediate, efficient, cost-effective interventions.
However, opening up federal lands will do little to meaningfully increase housing supply or affordability in the areas where it's most needed, given the remote location of most federally owned land. Moreover, the downsides are significant: many of these lands serve vital public functions, including recreation, timber production (especially important as Canadian timber imports are increasingly taxed), and the protection of ecologically sensitive areas, wetlands, and commercial fisheries.
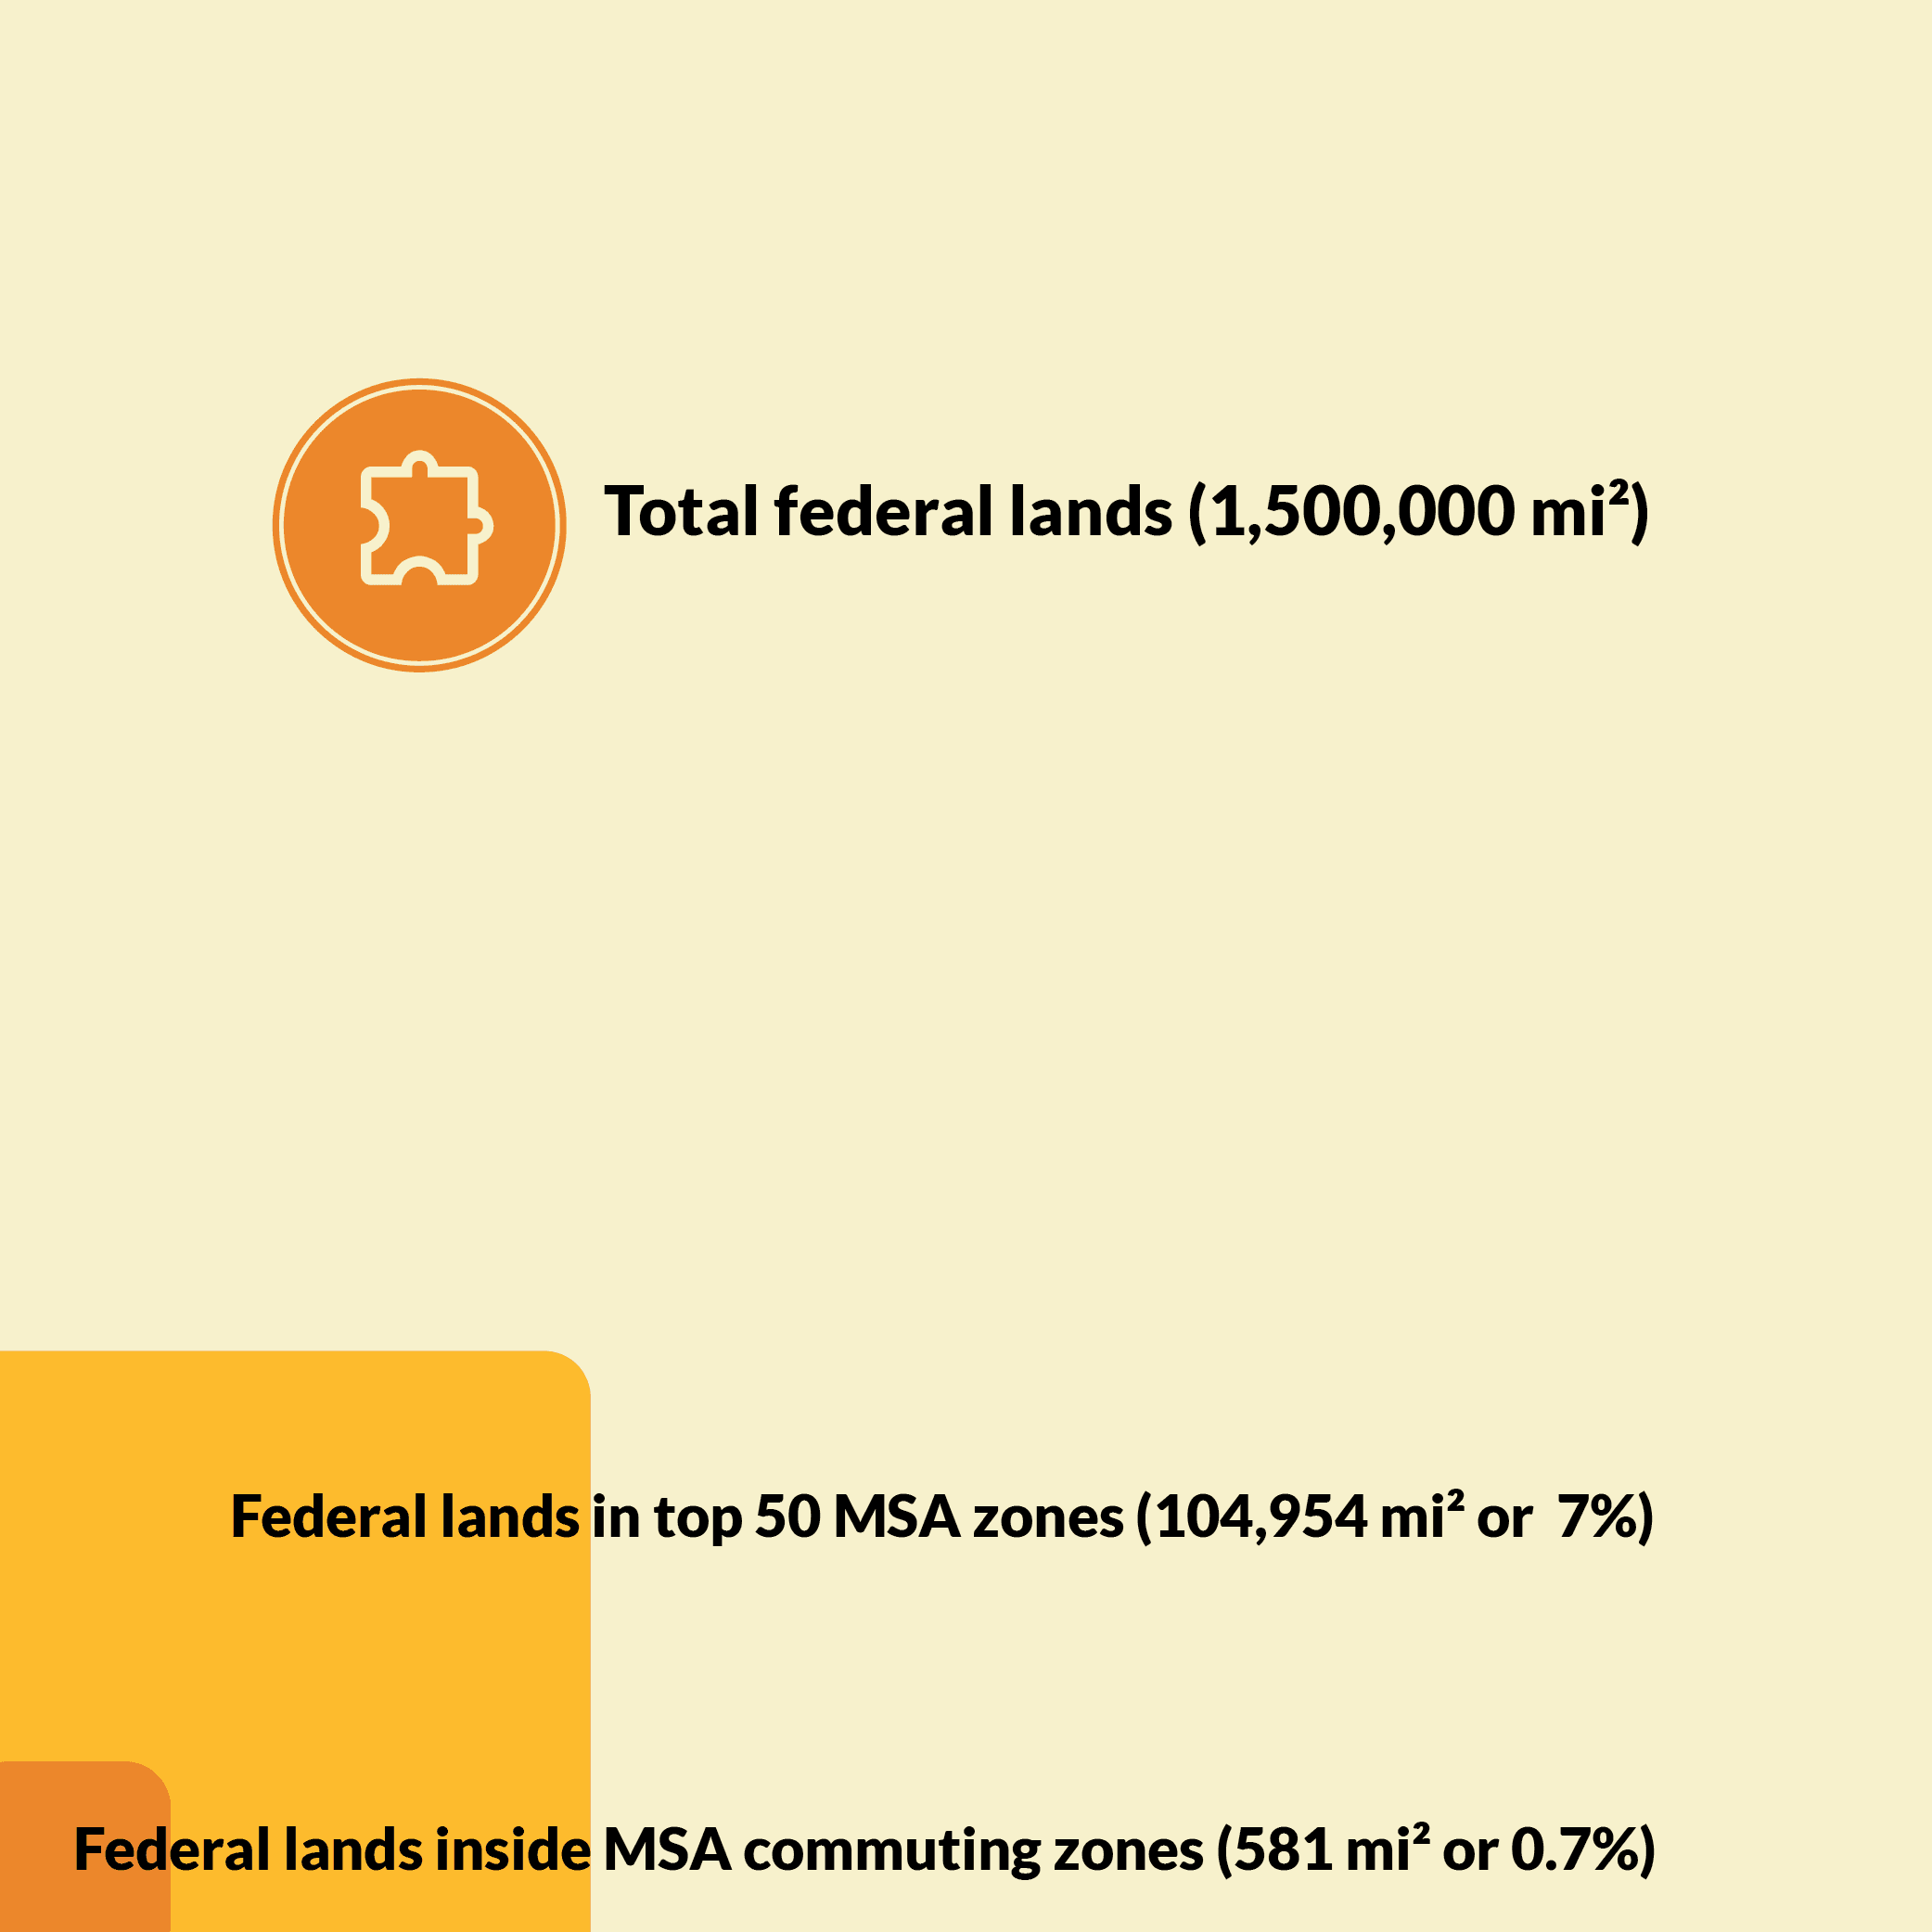
While increasing housing supply is critical to alleviating housing costs, opening up federal land managed by the Bureau of Land Management, the Bureau of Reclamation, the Fish and Wildlife Service, and the Forest Service for development is unlikely to move the needle in ways that would meaningfully address the housing crisis. To assess this, we analyzed federal lands in the nation's largest 50 metropolitan statistical areas (MSAs) by population–where the housing crisis is most acute–and found that they have very little of this type of federal land is viable for development. Opening up these lands would not have a substantive market influence nationally. A more widespread effort to develop federal lands beyond sites in existing job centers would also require significant infrastructure investment, and many would likely face climate risks and significant resource constraints.
For this policy to help alleviate the housing crisis, we urge any federal lands work to focus on sites in existing job centers, ideally infill sites that have a higher potential for density and access to amenities and economic opportunity. Based on our analysis, this calls for a shift in focus away from federal land predominantly used for recreation, conservation, and forest management that is largely remote towards an assessment of the development potential of other more efficiently located federal properties currently being utilized as warehousing, office space, or parking, that may be better used as housing. However, while bringing these underutilized infill sites in job centers to more productive use would be a positive step forward to address housing supply, it is almost certainly still insufficient on its own to address the level of housing need.

Analyzing federal lands in America’s MSAs
In response to the new initiative set up by Secretary Turner, we decided to test how much federal land would be primed for development. To do this, we first focused this analysis on the largest 50 MSAs by population because these are the places where housing affordability issues are most acute. Then, we identified their population center, known as the “mean center of population.” The largest 50 MSAs are significant because they account for 55% of the US population and 65% of the national GDP, according to the U.S. Census and BEA.
Secondly, we identified a 45-minute drive-time radius towards that center on a typical weekday morning, which should also cover transit commute zones since those are usually smaller. We can consider this a “commuting zone”: Employees want to live within a reasonable distance to the urban core, and commuters are typically unwilling to commute more than 45 minutes via car, even with recent work-from-home trends–the average commute trip is about 28 minutes in U.S. MSAs, according to the National Household Travel Survey.
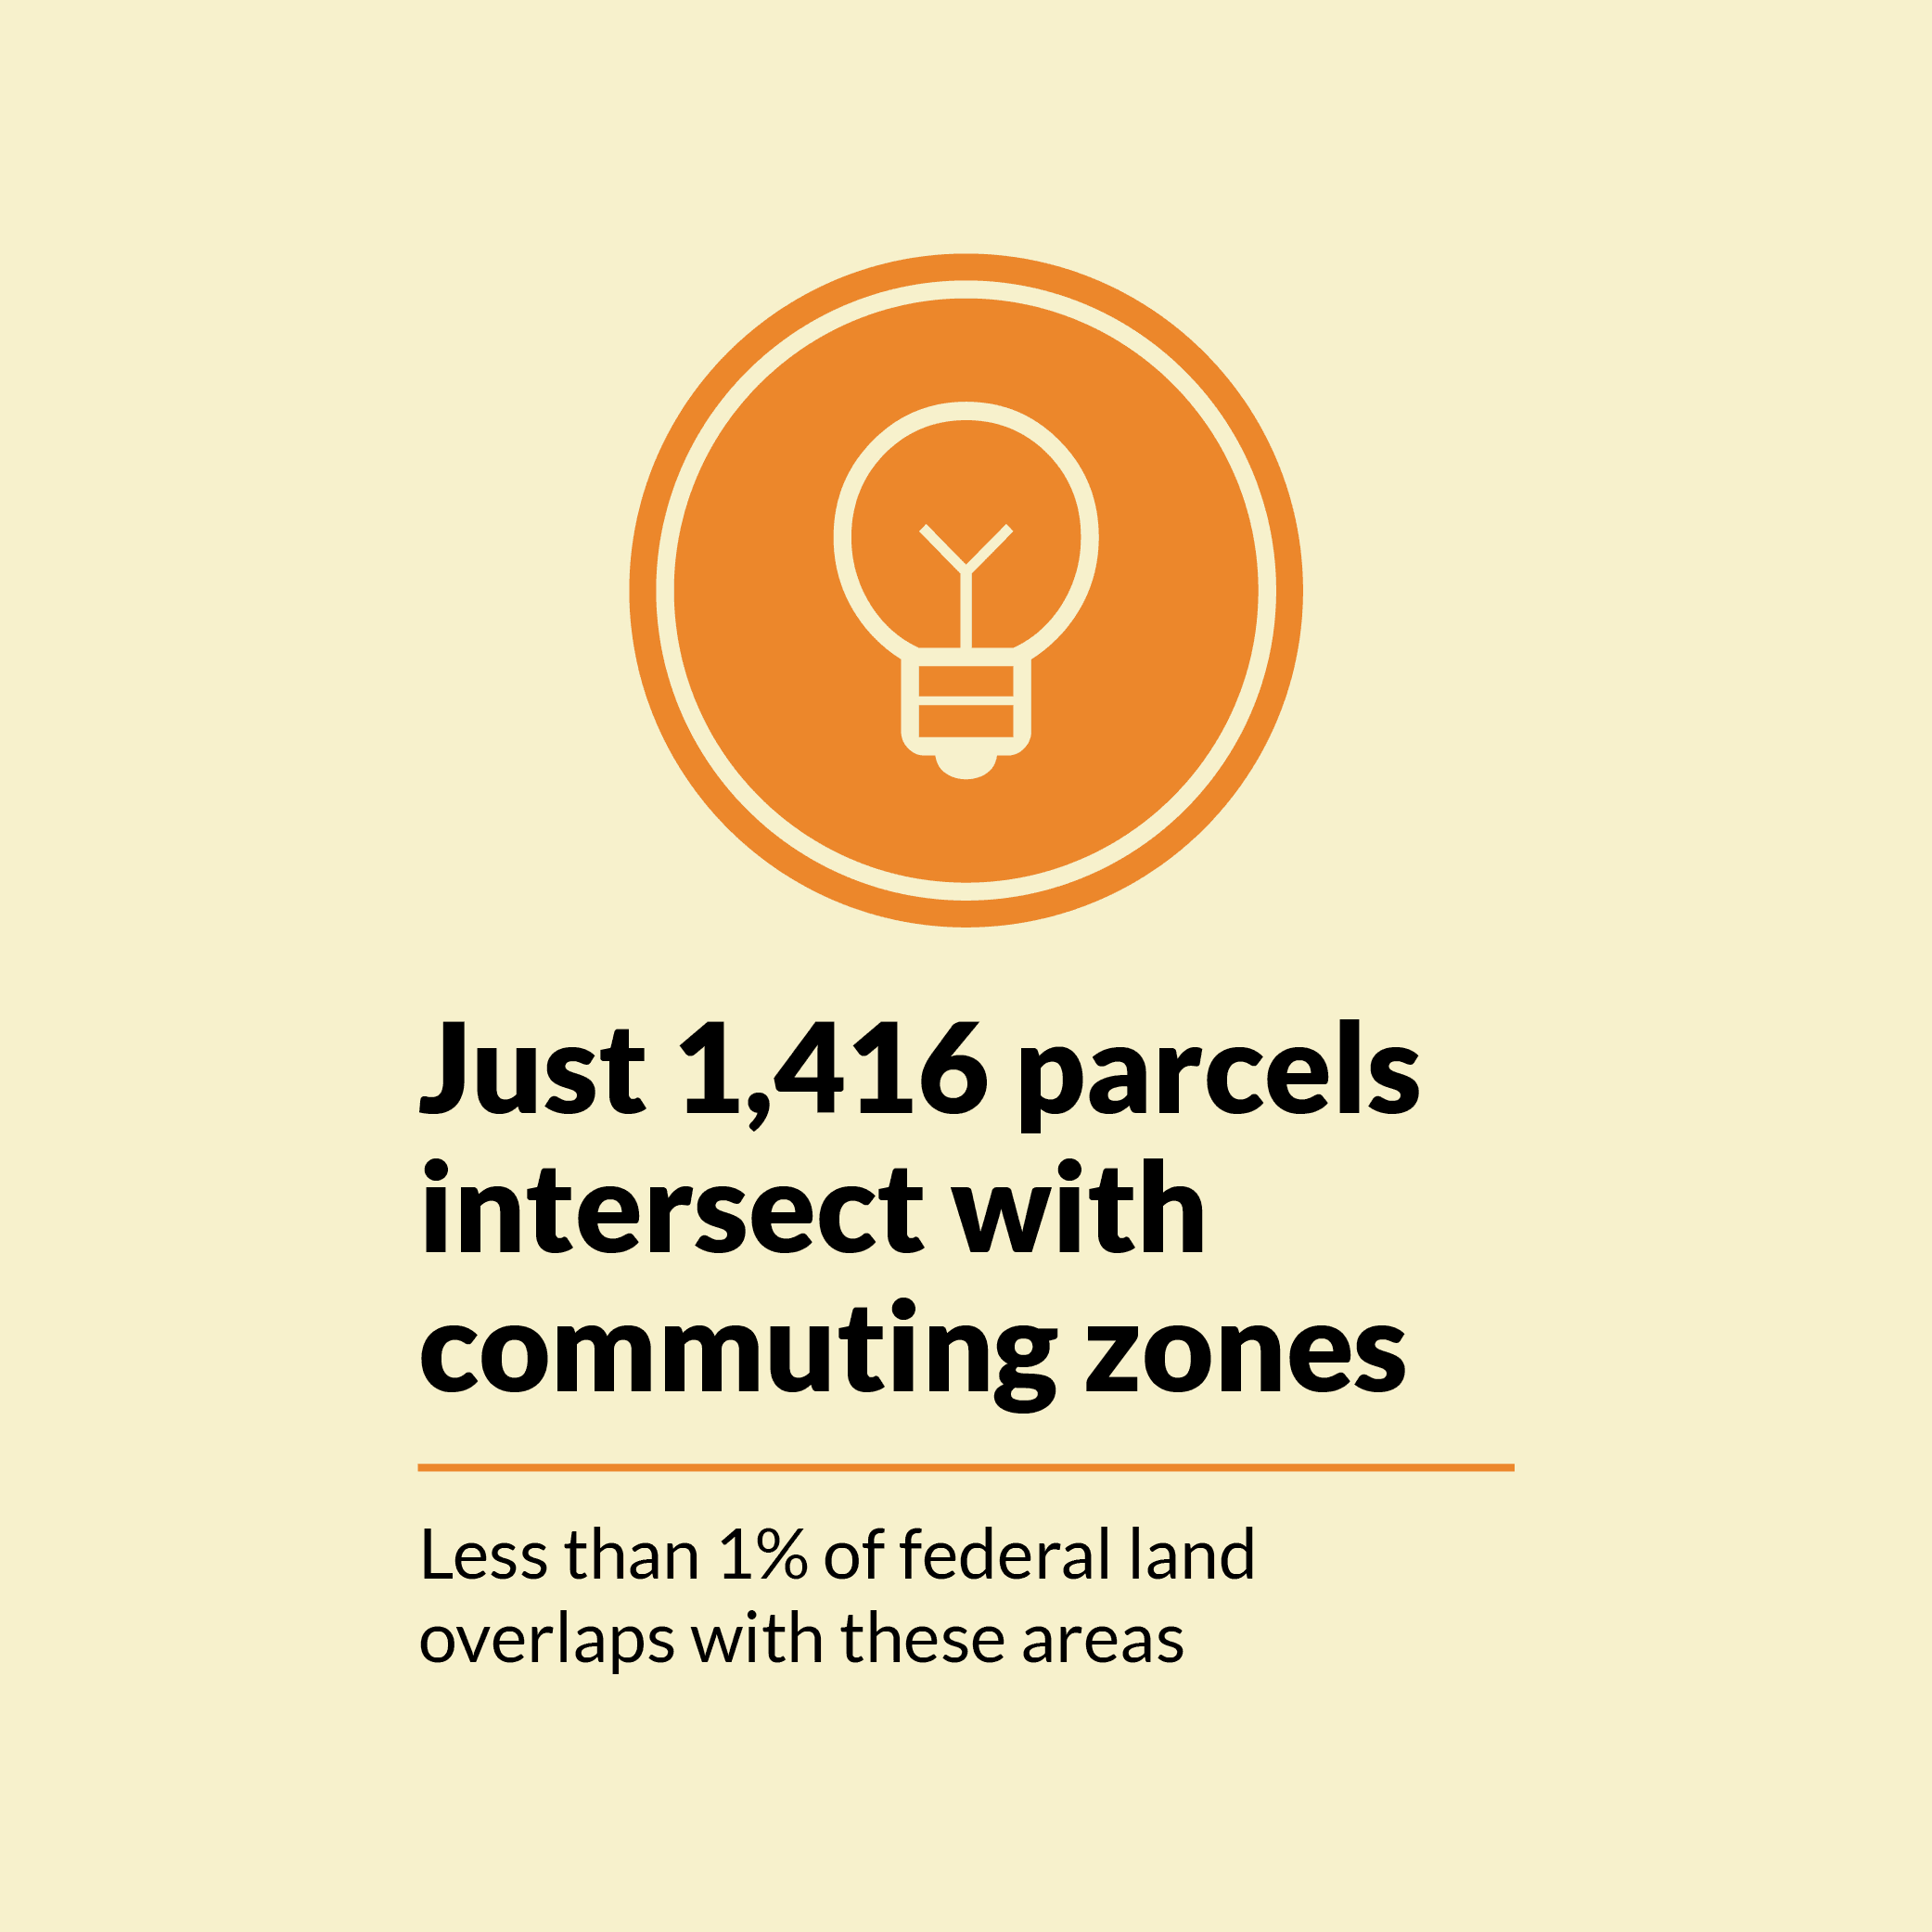
Finally, we identify the federal lands within these commuting zones. For this analysis, we included lands from the Bureau of Land Management, the Bureau of Reclamation, the Fish and Wildlife Service, and the Forest Service. We excluded Department of Defense lands and National Parks, as those areas are unlikely to be returned to states. This study also did not include federally-owned buildings and other assets such as courthouses, post offices, or transportation facilities; assessing these individual sites for their level of usage (such as amount of parking on site) would be a further study and should consider both community use of the existing services and opportunity to address housing needs.
At a typical gross suburban gross housing density of 200 housing units per sq. mi. (0.31 units per acre),These densities are gross housing density, meaning they are the raw average of overall land. This differs from the density of a specific development, which usually is above one unit per acre in most urban land. The reason for these differences is that gross density includes all land, not just the specific parcels slated for development. which may be a typical approach for suburban fringe sites, this would allow for a total of 118,000 new housing units. This figure could grow substantially if development proceeded at the 2020 census’s typical urban density of 425 units per square mile or more, given the progress in the development of multi-family housing by right in many markets. However, these figures alone are simply not substantial enough to address the current housing need. Recent studies have suggested the nation needs to build upwards of 4.5 million new homes, and the Los Angeles MSA has a shortage of 400,000 housing units alone!
The quantity of housing possible on these federal lands would be imperceptible to the national housing market and local housing markets, as shown below.
Federal Lands by MSA
The only top 50 MSA with a large share of federal land is Las Vegas, where these lands make up 28 percent of the commuting zone. There are 221 square miles of federally owned land in the region—mostly in the desert—that could theoretically accommodate around 44,000 homes. However, two serious questions arise. First, what is the viability of further development in an arid region already facing severe and worsening water constraints? And second, does the region want to continue a sprawling development pattern that requires costly new infrastructure while contributing to higher emissions, increased urban heat island effects, and deeper dependence on cars?
As reporting from Inside Climate News has documented, the Las Vegas region is already stretching the limits of its water supply from the Colorado River, which is now in its 23rd year of drought. Meanwhile, new developments continue to march toward conservation areas like Sloan Canyon and Red Rock Canyon, fueling further loss of habitat and increasing demand for long-term water infrastructure like pipelines through protected lands. Environmental groups have also raised concerns that the so-called conservation offsets in land bills, such as the Clark County Lands Bill, mostly re-designate already protected areas while opening up large tracts of intact desert for growth. In this light, the development of federal lands around Las Vegas not only risks worsening climate impacts—it also may undermine the region’s sustainable future.
On down the list, New Orleans (5.3%), San Diego (3.2%), and San Jose (3.2%) have some substantive portion of federal lands. Although, in many cases, those are near sensitive ecological areas or in coastal areas prone to flood risk and high flood insurance costs.
Further, 15 of the largest 50 MSAs have zero federal lands (as defined by this study) within their employment catchment areas per our analysis, including high-cost New York and growing areas like Tampa, Nashville, Houston, Dallas, Atlanta, and Charlotte. As a result, this policy offers no relief to these fast-growing and high-cost regions struggling with housing supply.
Policy Implications
As Secretaries Turner and Burgum wrote, this initiative is not intended as a "free-for-all" but a targeted strategy to address the housing crisis while protecting cherished public lands. That’s a worthy pursuit. But in practice, even a highly optimistic scenario—where all viable federal lands as traditionally defined in the commuting zones of the top 50 MSAs is developed—would yield only 118,000 homes. Even at two to three times the assumed density here, the numbers would be small in comparison to America’s housing needs. This is a drop in the bucket compared to the millions of units needed nationally and the hundreds of thousands needed in the largest metro areas.
Worse, the focus on federal land risks diverting attention from far more impactful solutions—like infill development, missing-middle housing, and zoning reform—while encouraging costly sprawl in areas that already have ample capacity within their borders. Focusing on the development of federal lands on unserviced sites on the outskirts of metropolitan areas would also burden municipalities with infrastructure costs and threaten ecologically valuable lands.
In short, opening federal lands to housing may sound like an impactful strategy, but it’s not the scale of solution the crisis demands—and it comes with trade-offs we can’t afford.
Related News


Livable places. Healthy people. Shared prosperity.


© 2026 Smart Growth America. All rights reserved
Site By3Lane Marketing
