


Resource
Dangerous By Design 2021

Dangerous By Design 2021
The number of people struck and killed by drivers nationwide while walking increased by an astonishing 45 percent over the last decade (2010-2019).
The four most recent years on record (2016-2019) are the most deadly years for pedestrian deaths since 1990. During this ten-year period, 53,435 people were hit and killed by drivers.
In 2019, the 6,237 people killed is the equivalent of more than 17 people dying per day.
If these statements feel familiar, it’s because they are, painfully so. It has been more than a decade since the first edition of Dangerous by Design, and this problem has only gotten worse. Dangerous by Design 2021 takes a closer look at this alarming epidemic.
What this report shows is that our streets aren’t getting safer. Even more so, while traffic deaths impact every community in the United States, states and metropolitan areas across the southern continental United States, older adults, people of color, and people walking in low-income communities bear a higher share of this harm.
This report is accompanied by an interactive maps of pedestrian fatalities from the period in the report as well as sortable tables of all state- and metro-level data.
Related Resources

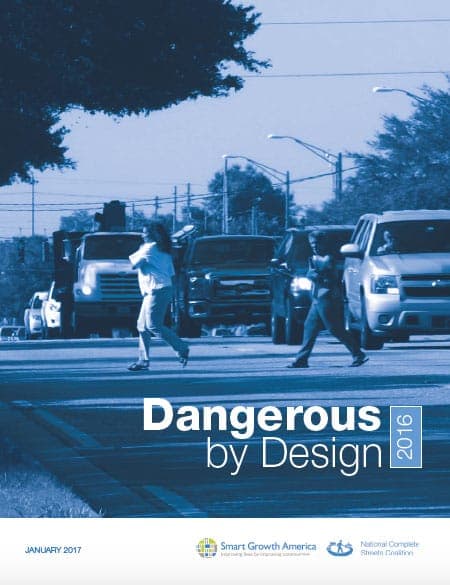
Dangerous by Design 2016
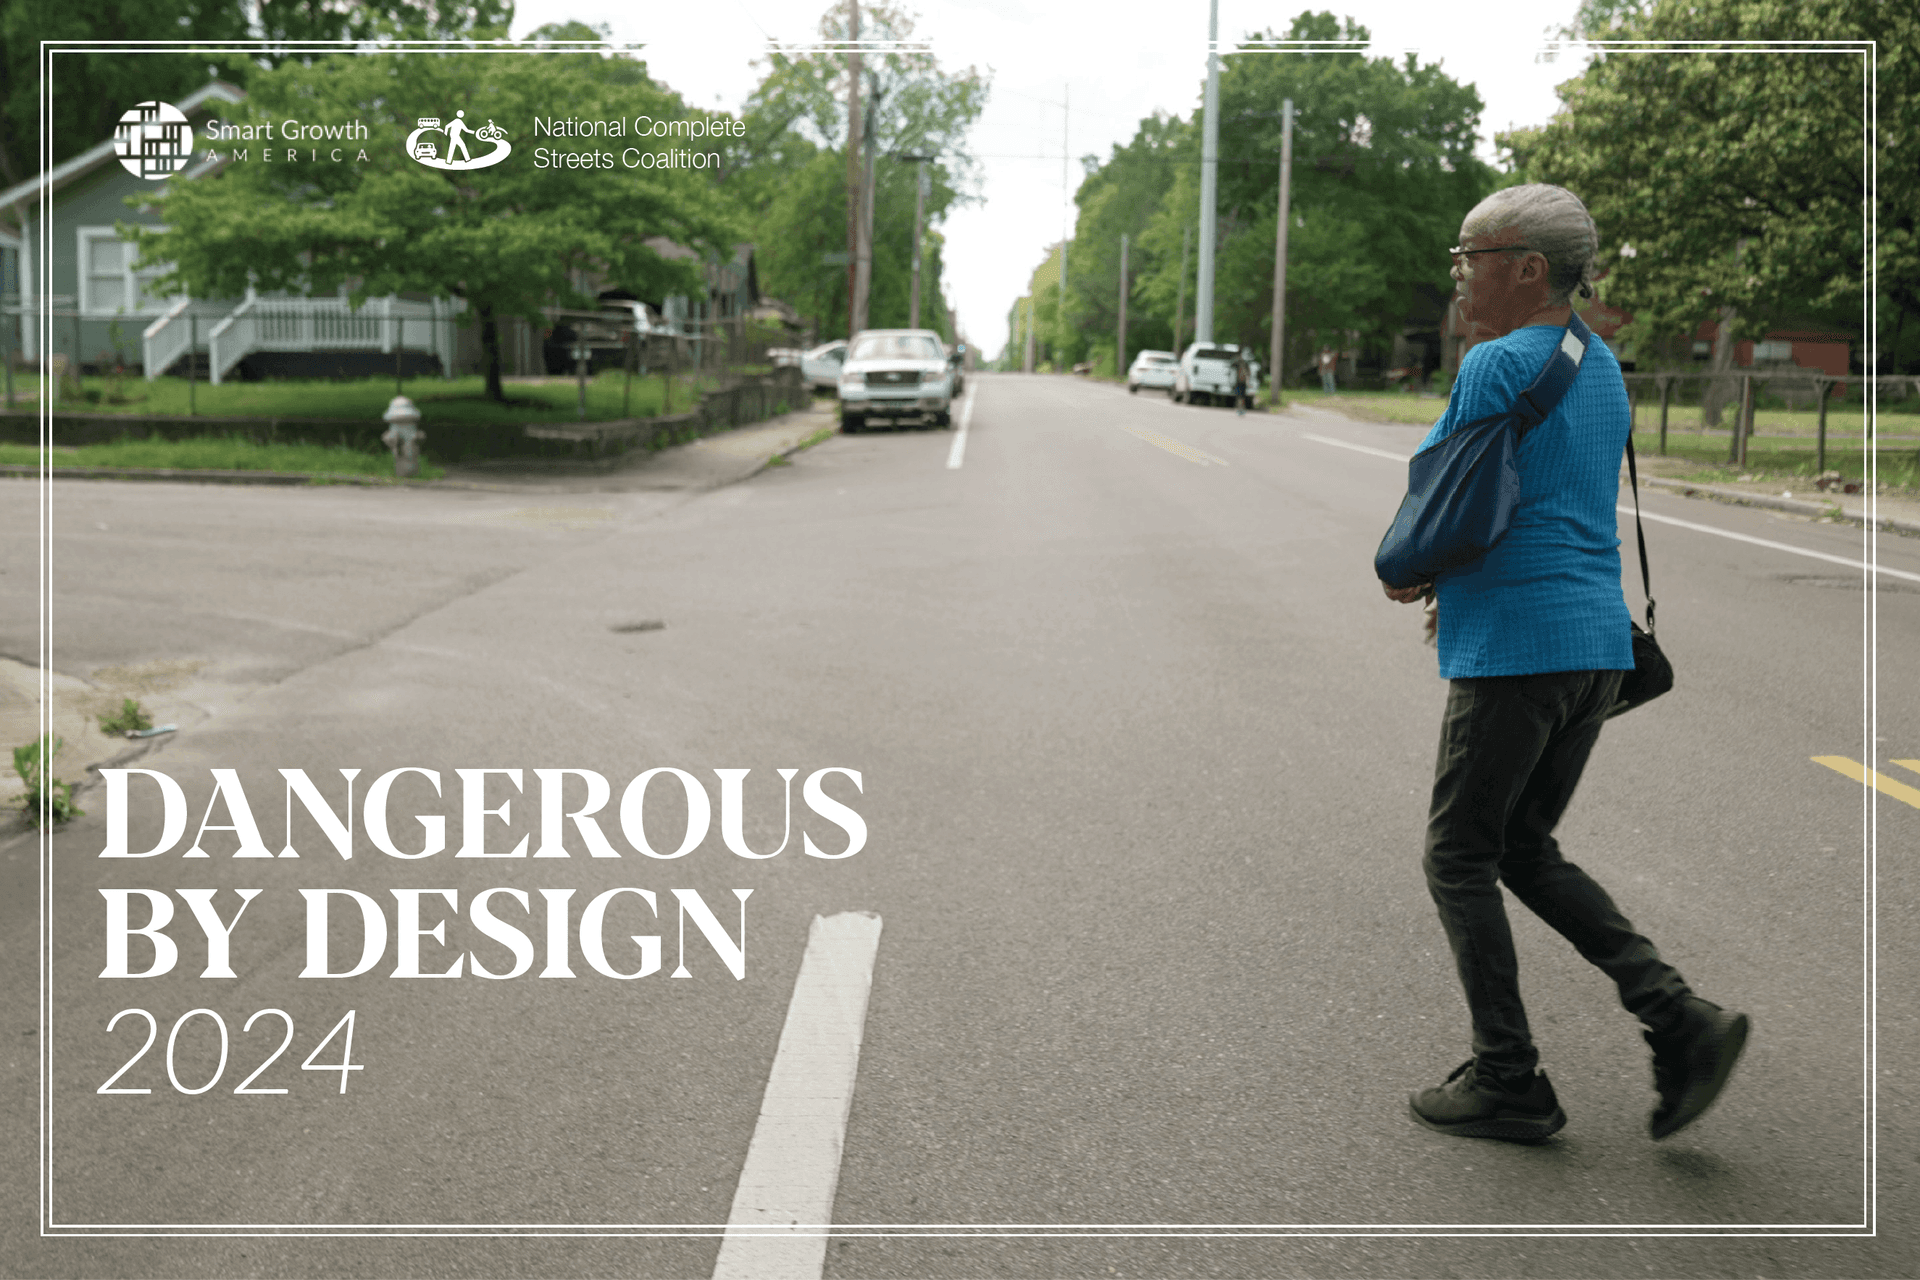
Dangerous by Design 2024
Dangerous by Design 2019

Dangerous by Design 2022
Dangerous by Design 2014
Livable places. Healthy people. Shared prosperity.


© 2026 Smart Growth America. All rights reserved
Site By3Lane Marketing
