Transportation for America responds to House T&I authorization proposal

Crossposted from Transportation for America.

WASHINGTON, DC – Today, House Transportation and Infrastructure committee chairman John Mica (R-FL) released an outline of principles for a proposed six-year transportation bill. The $230 billion, six-year proposal represents a 35 percent spending reduction with potentially significant impacts on road and bridge repair and maintenance, as well as public transportation and safer walking and bicycling. James Corless, director of Transportation for America, had this to say in response to the Chairman’s proposal on state flexibility, transit funding and streamlining project delivery:

“We commend Chairman Mica and his fellow drafters on the push to get this long-stalled bill moving, and we appreciate the effort to consolidate programs, leverage non-federal resources and deliver projects more quickly. However, we are skeptical that investments at this level can meet the country’s infrastructure needs.

Uncategorized

Tell your story: 15.5 million seniors will have poor or non-existent transit access in 2015. How will it affect you?

Crossposted from Transportation for America

By 2015, more than 15.5 million Americans 65 and older will live in communities where public transportation service is poor or non-existent. That number will continue to grow rapidly as the baby boom generation “ages in place” in suburbs and exurbs with few mobility options for those who do not drive.

How will we address the shrinking mobility options of baby boomers who wish to stay in their homes and age in place? What happens when people in the largest generation in American history outlive their ability to drive for everything?

We want to know how the lack of transit access or other options affects you. Whether you’re a senior or have a parent or grandparent getting older in places with poor transportation options, we want to hear real stories of how this will affect real people in the coming years. We’re partnering with AARP to gather stories about how you or someone you know is or will be affected by the lack of transportation options.

Share your story with AARP today, which is joining with T4 America to gather compelling stories to share with Congress.

With Congress set to introduce a transportation bill that will determine how to spend our transportation money for the next 6 years, we need to make it clear to Congress how their decisions will impact real people.

Uncategorized

Aging in Place, Stuck without Options: a new report from Transportation for America

By 2015, more than 15.5 million Americans 65 and older will live in communities where public transportation service is poor or non-existent. That number is expected to continue to grow rapidly as the baby boom generation “ages in place” in suburbs and exurbs with few mobility options for those who do not drive.

Aging in Place, Stuck without Options ranks metro areas by the percentage of seniors with poor access to public transportation, now and in the coming years, and presents other data on aging and transportation.

The analysis by the Center for Neighborhood Technology evaluates metro areas within each of five size categories. It shows that in just four years, 90 percent of seniors in metro Atlanta will live in neighborhoods with poor access to options other than driving, the worst ranking among metro areas with populations over 3 million. In that size category, metro Atlanta is followed by the Riverside-San Bernardino, CA metro area, along with Houston, Detroit and Dallas. Kansas City tops the list for metros of 1-3 million, followed by Oklahoma City, Fort Worth, Nashville and Raleigh-Durham.

The transportation issues of an aging America are national in scope, and cash-strapped state and local governments will be looking for federal support in meeting their needs. As Congress prepares this summer to adopt a new, long-term transportation authorization, this report outlines policies to help ensure that older Americans can remain mobile, active and independent.

Click here to download the full report and read more from Transportation for America >>

Uncategorized

Transportation for America releases Dangerous by Design 2011

In the last decade, from 2000 through 2009, more than 47,700 pedestrians were killed in the United States – the equivalent of a jumbo jet full of passengers crashing roughly every month. On top of that, more than 688,000 pedestrians were injured during that time as well – a number equivalent to a pedestrian being struck by a car or truck every 7 minutes.

Despite the magnitude of these avoidable tragedies, little public attention and even less in public resources have been committed to reducing pedestrian deaths and injuries in the United States. On the contrary, transportation agencies typically prioritize speeding traffic over the safety of people on foot or other vulnerable road users.

Transportation for America’s Dangerous by Design 2011 examines this problem and America’s streets that are “dangerous by design” — engineered for speeding traffic with little or no provision for people on foot, in wheelchairs or on bicycles.

This year’s edition of the report is accompanied by an interactive map that tracks pedestrian fatalities from 2001 to 2009 across the country. Type an address and click on any point to see the available information about the victim, the date, the location, the street type and even what the road looks like via Google Street View.

Uncategorized

Rockefeller and Pew: States need to strengthen performance measures

Crossposted from Transportation for America’s blog.
Written by Sean Barry.

Many states fail to track the results of their transportation dollars, according to a new report by the Pew Center on the States and the Rockefeller Foundation.

The report, Measuring Transportation Investments: The Road to Results, is quick to tie the timing of its findings to the current debate over including more performance measures in a reauthorization of the nation’s surface transportation law. An unofficial version of the Obama administration bill makes performance and accountability a key component of the federal program.

The report ranked the 50 states and the District of Columbia according to six key goals: safety, jobs and commerce, mobility, access, environmental stewardship and infrastructure preservation.

Uncategorized

U.S. mayors say no to new revenue for transportation without reform

Crossposted from Transportation for America’s blog.

A supermajority of America’s mayors surveyed by the U.S. Conference of Mayors are clamoring for a reorientation in our nation’s transportation policy toward fixing what we have and investing in new options.

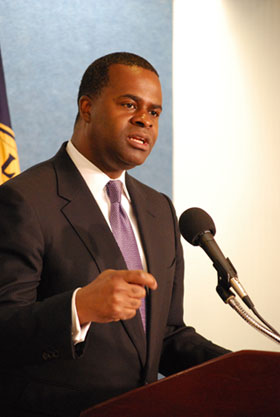
Ninety-eight percent of mayors identified affordable, reliable transit as crucial to their city’s recovery and growth, according to a survey of 176 mayors unveiled this week by Atlanta Mayor Kasim Reed (right) on behalf of the Conference.

Commanding majorities favor an increase in the federal gasoline tax, but only if more funding is allocated to transit, biking and walking, and local governments are given greater discretion over project selection. Eighty-percent said new highway projects should be a low priority, preferring to focus on repairing and maintaining what we have. Federal financing tools like Build America Bonds or the TIFIA programs receive the support of 75 percent of mayors.

The mayors also agree with T4 America that finding new revenue sources for a larger transportation bill without changing any policies is a non-starter. Just 7 percent of respondents said they would support a gas tax increase without a shift in priorities.

Uncategorized

New report and interactive map shows the state of our nation's bridges

Crossposted from Transportation for America

69,223 bridges – representing more than 11 percent of all U.S. highway bridges – are classified as “structurally deficient,” requiring significant maintenance, rehabilitation or replacement, according to a new T4 America report released today, The Fix We’re In: The State of Our Nation’s Bridges.

Those are the facts, and 69,000 bridges sure sounds like a lot, but what does that look like in real terms? Where are these bridges? Does your city or state have a lot of deficient bridges, or does the state do a good job taking care of them? Those questions are going to be much easier to answer with our online tools accompanying the report, launching today at t4america.org/resources/bridges.

We’ve taken the whole federal bridge database and put it online in a map, so you can type your address, and see all the bridges within a ten-mile radius. Structurally deficient bridges will show up as red icons. Click any bridge and you’ll get more information about it, including its rating in a box on the right.

Curious about how your state stacks up? Click on “By State” and click your state to see a quick overview of their performance, including the best and worst five counties, as well as their rank nationally and total percentage of structurally deficient bridges.

The national report and all 51 state reports are being officially released today at noon with a national telebriefing, but you can go ahead and check out the map and data now on our site. (Media members? Contact david.goldberg [at] t4america [dot] org if you want information on the telebriefing.)

Check out the map today and please spread the word about it. We’ll be posting several times throughout the day with more information about the national report, which is available for download now — as well as reports for all 50 states and D.C.

Uncategorized

Urban mobility report paints flawed picture of congestion, solutions

Crossposted from Transportation for America.

The Urban Mobility Report is an important reminder that too many Americans are stuck without good options for efficient, safe and affordable travel in our cities and towns. It is especially timely as Congress prepares to reset priorities for investing our transportation trust fund. However, we must note that flaws in the UMR’s analysis could lead to faulty conclusions about what the report indicates.

Uncategorized

Equity Caucus at Transportation for America Launches in Washington, DC

Advocates from the NAACP, Change to Win, the Leadership Conference on Civil and Human Rights and 60 other prominent organizations came together in Washington, DC last night to launch the Equity Caucus at Transportation for America. The Caucus consists of an incredibly wide array of leaders working together to make transportation in the United States more equitable, including many organizations – such as Good Jobs First and the Center for Working Families – that work primarily on issues other than transportation. As co-chair of the Transportation for America campaign, Smart Growth America is proud to be part of such a diverse group of organizations working to bring fair access to transportation choices to all people.

Uncategorized

Smart Growth America Applauds National Transportation Equity Coalition

As co-chair of the Transportation for America campaign, Smart Growth America is proud to help launch the nation’s leading civil rights, community development, racial justice, economic justice, faith-based, health, housing, labor, environmental justice, tribal, and transportation organizations to create the Equity Caucus at Transportation for America. Transportation is a crucial part of the path to … Continued

Uncategorized